Opinion Pieces: since 2007, Prof. David Hensher has written an opinion column in the Australasian Bus and Coach magazine, where he monthly discusses a lot of different transport-related hot topics. In this section we are revisiting these columns.
August 2009
Have you ever stopped to think about how much people spend each year on tolls, compared with petrol, in using their cars in cities where there is an extensive and growing tolled road network? Let’s look at Sydney (see the Figure below).
It is generally assumed that the average kilometres that a car is driven per annum (privately and company registered vehicles) is 15,000 kms. Given the current average retail price of unleaded petrol of around $1.25 (accounting for premium unleaded in the mix), and an average fuel efficiency of say 9 litres per 100kms, then the average fuel bill per annum is $1,687. Depending on where one lives in Sydney, as well as where one visits (including the work location), tolls paid per annum can be as high as $4,400 per annum for someone living in the Hills district, working in the CBD and using the M2/Lane Cove Tunnel/Harbour Bridge each day of the week for 45 weeks per annum. If you choose to avoid Lane Cove Tunnel, the annual toll impost is $3,100 per annum. Tolls in Sydney for those regularly using tollroads from the Hills district put the price of fuel in perspective!
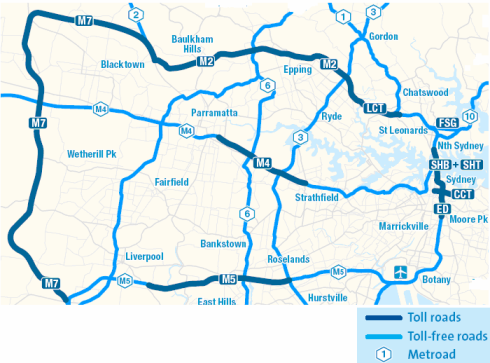
Figure: The network of Sydney’s Toll roads
Note: Metroad is the non-tolled metropolitan freeway network
Source: NRMA
| Tollroad | Length | Current tolls (GST included) |
| M2 | 21km | Based on the toll plaza and vehicle size |
| M4 | 40km | $2.75 for Class 2 |
| M5 | 22km | $2.75 for Class 2 |
| M7 | 40km | Distance based charge, 33.25 cents per km (< 20 km), $6.65 trip cap for all vehicles |
| CCT | 2.1km | Based on the route and vehicle size |
| LCT/FSG | 3.6km | $2.72 (LCT) and $1.36 (FSG) for Class A; $5.45 (LCT) and $2.72 (FSG) for Class B |
| ED | 6km | $5.00 for Class 2 vehicles; $10 for others (Northbound only) |
| SHT | 2.3km | Time of day tolling (Southbound only) |
| SHB | 1.15km | Time of day tolling (Southbound only) |
Of course, not everyone uses toll roads, and indeed the 38 kilometres of tollroads do not cover all trip contexts. Indeed 18 percent of all residents in Sydney regularly use tollroads, and from the Hills District we are talking about over 80,000 trips each way per day where tolls are paid, the equivalent of approximately $125m per annum. This is equivalent to approximately $3,300 per car per annum.
The fact that tollroads are getting expensive for many trip situations around the Sydney metropolitan area, should raise questions about how long people will be willing to pay increasingly high tolls? The answer must lie in part with the travel time savings offered and the service levels of alternative modes of transport. It is interesting to note that 9 of the top 10 roads with the slowest speeds in Sydney in the peak periods are toll roads (the worst road in Sydney being a free road – Victoria Road). With buses benefitting by a dedicated lane on a number of the tollroads, and which are often seen speeding past the crawling car traffic, the elements of a clear message that bus services can do a better job than the car is starting to emerge. What also is emerging, however, is the apparent patience of many commuters who would still sit in their air conditioned/heated car, especially in the cooler months, without coughing commuters on buses and trains, and having to stand for quite a high percentage of the journey. Clearly we are prepared to pay
a lot for getting a seat, which is guaranteed with car use but not for bus and train (and appears to be getting worse for train in particular).
Food for thought
¿Comments? ¿Opinions? ¿Similar News? Send them to us!

