A BRT for the metropolitan area of Asunción (in Spanish)
Source: SIBRT
Asunción – El área Metropolitana de la capital paraguaya se prepara para el lanzamiento de las primera licitaciones de obras del primer troncal de Bus Rapid Transit (BRT), que será incorporado gracias al prestado otorgado por el Banco Interamericano de Desarrollo – BID, al Gobierno del Presidente Fernando Lugo. Coincidiendo con la visita de la vicepresidenta del BID, Julie Katzman, anunció la ampliación del primer troncal de BRT.
La representante del alto organismo financiero internacional, recorrió la zona donde se ejecutaran los dos proyectos financiados con aproximadamente U$S 160 millones compuestos por el BRT y el Proyecto Reconversión del Centro y Edificios de Gobierno, recientemente aceptado por el Gobierno Nacional, finalizando su recorrida por la zona de obras de la Avenida Costanera, el parque Bicentenario y la zona de Puertos donde existen componentes ambientales que serian de interés del Banco.
El proyecto de BRT, que inicialmente tenía previsto recorrer y conectar a tres ciudades en su recorrido, se amplía hasta la ciudad de Capiatá, ante la demanda de usuarios localizados en esa ciudad conforme a los datos arrojados por los estudios de Origen y Destino procesados en el marco de lineamientos que permiten hacer los ajustes al proyecto.
El proyecto, que inicialmente era de unos 18 kilómetros, en la actualidad fue extendido hasta Capiatá amplíando 10 Km su recorrido original debido a la demanda de usuarios desde esta ciudad cabecera de la capital paraguaya. En estos momentos se realizan todos los estudios que incluyen movimiento de pasajeros, origen, destino y nivel de demanda que propiciarán los horarios de los buses” remarcó el titular de la cartera de obras.
El Ministerio de Obras Públicas y Comunicaciones anunció que la licitación para el sistema BRT se realizará en julio y se espera su conclusión para fines de 2012 o comienzos del 2013.
¿Comments? ¿Opinions? ¿Similar News? Send them to us!
Tweet
Across Europe, irking drivers is urban policy
Source: The New York Times by Elizabeth Rosenthal

Pedestrians and trams are given priority treatment in Zurich. Tram operators can turn traffic lights in their favor as they
approach, forcing cars to halt. Photo: Christoph Bangert for The New York Times. More photos >>
ZURICH — While American cities are synchronizing green lights to improve traffic flow and offering apps to help drivers find parking, many European cities are doing the opposite: creating environments openly hostile to cars. The methods vary, but the mission is clear — to make car use expensive and just plain miserable enough to tilt drivers toward more environmentally friendly modes of transportation.
Cities including Vienna to Munich and Copenhagen have closed vast swaths of streets to car traffic. Barcelona and Paris have had car lanes eroded by popular bike-sharing programs. Drivers in London and Stockholm pay hefty congestion charges just for entering the heart of the city. And over the past two years, dozens of German cities have joined a national network of “environmental zones” where only cars with low carbon dioxide emissions may enter.
Likeminded cities welcome new shopping malls and apartment buildings but severely restrict the allowable number of parking spaces. On-street parking is vanishing. In recent years, even former car capitals like Munich have evolved into “walkers’ paradises,” said Lee Schipper, a senior research engineer at Stanford University who specializes in sustainable transportation.
“In the United States, there has been much more of a tendency to adapt cities to accommodate driving,” said Peder Jensen, head of the Energy and Transport Group at the European Environment Agency. “Here there has been more movement to make cities more livable for people, to get cities relatively free of cars.”
To that end, the municipal Traffic Planning Department here in Zurich has been working overtime in recent years to torment drivers. Closely spaced red lights have been added on roads into town, causing delays and angst for commuters. Pedestrian underpasses that once allowed traffic to flow freely across major intersections have been removed. Operators in the city’s ever expanding tram system can turn traffic lights in their favor as they approach, forcing cars to halt.
Around Löwenplatz, one of Zurich’s busiest squares, cars are now banned on many blocks. Where permitted, their speed is limited to a snail’s pace so that crosswalks and crossing signs can be removed entirely, giving people on foot the right to cross anywhere they like at any time.
As he stood watching a few cars inch through a mass of bicycles and pedestrians, the city’s chief traffic planner, Andy Fellmann, smiled. “Driving is a stop-and-go experience,” he said. “That’s what we like! Our goal is to reconquer public space for pedestrians, not to make it easy for drivers.”
While some American cities — notably San Francisco, which has “pedestrianized” parts of Market Street — have made similar efforts, they are still the exception in the United States, where it has been difficult to get people to imagine a life where cars are not entrenched, Dr. Schipper said.
Europe’s cities generally have stronger incentives to act. Built for the most part before the advent of cars, their narrow roads are poor at handling heavy traffic. Public transportation is generally better in Europe than in the United States, and gas often costs over $8 a gallon, contributing to driving costs that are two to three times greater per mile than in the United States, Dr. Schipper said.
What is more, European Union countries probably cannot meet a commitment under the Kyoto Protocol to reduce their carbon dioxide emissions unless they curb driving. The United States never ratified that pact.
Globally, emissions from transportation continue a relentless rise, with half of them coming from personal cars. Yet an important impulse behind Europe’s traffic reforms will be familiar to mayors in Los Angeles and Vienna alike: to make cities more inviting, with cleaner air and less traffic.
Michael Kodransky, global research manager at the Institute for Transportation and Development Policy (ITDP) in New York, which works with cities to reduce transport emissions, said that Europe was previously “on the same trajectory as the United States, with more people wanting to own more cars.” But in the past decade, there had been “a conscious shift in thinking, and firm policy,” he said. And it is having an effect.
After two decades of car ownership, Hans Von Matt, 52, who works in the insurance industry, sold his vehicle and now gets around Zurich by tram or bicycle, using a car-sharing service for trips out of the city. Carless households have increased from 40 to 45 percent in the last decade, and car owners use their vehicles less, city statistics show.
“There were big fights over whether to close this road or not — but now it is closed, and people got used to it” he said, alighting from his bicycle on Limmatquai, a riverside pedestrian zone lined with cafes that used to be two lanes of gridlock. Each major road closing has to be approved in a referendum.
Today 91 percent of the delegates to the Swiss Parliament take the tram to work.
Still, there is grumbling. “There are all these zones where you can only drive 20 or 30 kilometers per hour [about 12 to 18 miles an hour], which is rather stressful,” Thomas Rickli, a consultant, said as he parked his Jaguar in a lot at the edge of town. “It’s useless.”
Urban planners generally agree that a rise in car commuting is not desirable for cities anywhere.
Mr. Fellmann calculated that a person using a car took up 115 cubic meters (roughly 4,000 cubic feet) of urban space in Zurich while a pedestrian took three. “So it’s not really fair to everyone else if you take the car,” he said.
European cities also realized they could not meet increasingly strict World Health Organization guidelines for fine-particulate air pollution if cars continued to reign. Many American cities are likewise in “nonattainment” of their Clean Air Act requirements, but that fact “is just accepted here,” said Mr. Kodransky of the New York-based transportation institute.
It often takes extreme measures to get people out of their cars, and providing good public transportation is a crucial first step. One novel strategy in Europe is intentionally making it harder and more costly to park. “Parking is everywhere in the United States, but it’s disappearing from the urban space in Europe,” said Mr. Kodransky, whose recent report “Europe’s Parking U-Turn” surveys the shift.
Sihl City, a new Zurich mall, is three times the size of Brooklyn’s Atlantic Mall but has only 225 more parking spaces than Atlantic’s 625, and as a result, 70 percent of visitors get there by public transport, Mr. Kodransky said.
In Copenhagen, Mr. Jensen, at the European Environment Agency, said that his office building had more than 150 spaces for bicycles and only one for a car, to accommodate a disabled person.
While many building codes in Europe cap the number of parking spaces in new buildings to discourage car ownership, American codes conversely tend to stipulate a minimum number. New apartment complexes built along the light rail line in Denver devote their bottom eight floors to parking, making it “too easy” to get in the car rather than take advantage of rail transit, Mr. Kodransky said.
While Mayor Michael R. Bloomberg has generated controversy in New York by “pedestrianizing” a few areas like Times Square, many European cities have already closed vast areas to car traffic. Store owners in Zurich had worried that the closings would mean a drop in business, but that fear has proved unfounded, Mr. Fellmann said, because pedestrian traffic increased 30 to 40 percent where cars were banned.
With politicians and most citizens still largely behind them, Zurich’s planners continue their traffic-taming quest, shortening the green-light periods and lengthening the red with the goal that pedestrians wait no more than 20 seconds to cross.
“We would never synchronize green lights for cars with our philosophy,” said Pio Marzolini, a city official. “When I’m in other cities, I feel like I’m always waiting to cross a street. I can’t get used to the idea that I am worth less than a car.”
¿Comments? ¿Opinions? ¿Similar News? Send them to us!
Tweet
Configuration of Innovative Minibus Service in the Lisbon, Portugal, Municipality
The viability of implementing a new alternative intermediate transport mode in the Lisbon, Portugal, metropolitan area was examined. The intention of this new system was to combine the major strengths of both public transport and private vehicles to provide a competitive transport alternative for commuters from low and intermediate density areas, who do not create enough demand to sustain a high-quality public transport service. Conventional public transport systems can provide efficient space and energy consumption, whereas private vehicles have high levels of flexibility and are fast and always available. A comprehensive methodology is presented to encompass the generation of input data of the model on the basis of transport demand data involving spatial-temporal constraints, the possible location of the service stops, and the detailed characterization of the service operation. The global objective of the model is to design a self-sustainable system that would maximize the operator’s profit, not one that would satisfy all potential demand. The developed model uses supply parameters obtained through current bus operators in the region. However, the estimated values should be refined before service deployment. This assessment was performed, as an initial test bed for Lisbon and will be expanded to the whole metropolitan area. Results suggest that this service might be significantly profitable to the operator and a good alternative for single private car drivers. Implementation of this system may relieve some congestion during peak periods.
Indonesia’s transport initiatives
Source: The City Fix by Itir Sonuparlak
Jakarta’s chief of Railway Certification Department, M Sardjoko Hendrowijono, is asking for greater federal restrictions on private vehicle imports in an effort to balance the success of TransJakarta, Indonesia’s first bus rapid transit (BRT) system. “Hendrowijono admitted that TransJakarta bus had helped to overcome traffic congestion in Jakarta since it first operated in 2004,” reports Berita Jakarta, the city’s online media forum. “But if it is not counterbalanced by stopping the imports of both two wheels and four wheels vehicles, congestion will still continue to happen.”
Although Indonesia may still be accepting private vehicle imports, the citizens have spoken loud and clear: more car free days! Similar to Bogotá, Colombia’s Ciclovia or Minneapolis, Minnesota’s Open Streets, Jakarta’s Car Free Day, first conducted once a month, has gained so much positive attention that the city government is considering implementing it every week. Encouraging individuals to leave their cars at home, Jakarta’s Car Free Day opens the city streets to pedestrians and bicyclists, with only vehicular traffic being TransJakarta.
And although Jakarta citizens are excited about Car Free Days and the success of TransJakarta, Governor Fauzi Bowo’s administration has received poor ratings in dealing with traffic congestion. According to the Jakarta Post, only 29.4 percent of respondents thought that the Governor had performed well in providing decent public transportation. Despite Governor Bowo’s positive contributions to TransJakarta, like calling for improvements in driver recruitment and installing tracking devices in vehicles, 70 percent of the surveyed group still think that the Governor has failed in managing traffic.
Road construction and its effects on traffic may be part of the problem. Jakarta had initiated two construction projects on elevated roads back in January. Jakarta’s Traffic Police and Public Works had predicted that these construction projects would have a negative impact on the city’s already congested traffic at least until September 2011. Although the construction takes place between 10pm and 5am, the blocked lanes of construction have taken a toll on traffic.
Part of this construction is to provide a platform for the city’s ongoing Mass Rapid Transit System (MRT) project. The MRT will be a rail-based transport system that services over 110.3 km (68.5 miles) of Jakarta’s roads. The administration is relying heavily on the MRT to solve Jakarta’s congestion problems. With 7.34 million private vehicles in Jakarta today and a 9.5 percent growth rate in vehicular traffic in the past five years, public transportation does not seem to be a popular mode of transport. But even though public transport makes up only 2 percent of all trips, these services benefit 56 percent of all trips in Jakarta.
According to Tony Ibanez from Harvard University, a professor of urban planning and public policy, TransJakarta alone is capable in reducing private vehicle traffic. In fact, he encourages the city government to focus in developing BRT-based public transport schemes. “Each bus can accommodate 80-90 percent of passengers, more routes and lanes of TransJakarta bus must be built to serve the citizens,” Ibanez explained.
¿Comments? ¿Opinions? ¿Similar News? Send them to us!
Tweet
Assessing the cost of transfer inconvenience in public transport systems: A case study of the London Underground
Few studies have adequately assessed the cost of transfers in public transport systems, or provided useful guidance on transfer improvements, such as where to invest (which facility), how to invest (which aspect), and how much to invest (quantitative justification of the investment). This paper proposes a new method based on path choice,3 taking into account both the operator’s service supply and the customers’ subjective perceptions to assess transfer cost and to identify ways to reduce it. This method evaluates different transfer components (e.g., transfer walking, waiting, and penalty) with distinct policy solutions and differentiates between transfer stations and movements.
The method is applied to one of the largest and most complex public transport systems in the world, the London Underground (LUL), with a focus on 17 major transfer stations and 303 transfer movements. This study confirms that transfers pose a significant cost to LUL, and that cost is distributed unevenly across stations and across platforms at a station. Transfer stations are perceived very differently by passengers in terms of their overall cost and composition. The case study suggests that a better understanding of transfer behavior and improvements to the transfer experience could significantly benefit public transport systems.
Opinion Pieces: Pricing must be a priority, so must keep mentioning it
Opinion Pieces: since 2007, Prof. David Hensher has written an opinion column in the Australasian Bus and Coach magazine, where he monthly discusses a lot of different transport-related hot topics. In this section we are revisiting these columns.
July 2010
The Henry Review tells us that we must rethink the charging regime for cars and trucks. The two specific recommendation is that “Governments should analyse the potential network-wide benefits and costs of introducing variable congestion pricing on existing tolled roads (or lanes), and consider extending existing technology across heavily congested parts of the road network. Beyond that, new technologies may further enable wider application of road pricing if proven cost-effective. In general, congestion charges should apply to all registered vehicles using congested roads. The use of revenues should be transparent to the community and subject to further institutional reform.”
This must be of interest to the bus sector since the adage ‘to make public transport more attractive we must make the car less attractive’ still holds. Anyone who thinks you can build a solution through an injection of investment in public transport alone is foolhardy since it will do little to ease congestion on our transport networks. You have to manage congestion and not assume you can build your way out of it. What we need is an integrated program of carrots and sticks, linked to network operating plans, HOT/HOV lanes, improved public transport to attract car users, better land use/transport integration, and crucially, pricing reform, as recommended in the Moving People documents produced by BIC and UITP.
I remain fearful that governments of all persuasions in Australia will continue to ignore the crucial role of pricing of car use as a non-blunt instrument (one of the few such transport instruments we have). This issue is squarely in the space of politicians and marketing – the economic and technical issues of efficient charging of car use are more or less solved.
We can be thankful that The Netherlands is doing something about it with a congestion charging scheme that varies the price by location and time of day. We watch and hope it works and we can learn and follow. NXP Semiconductors and IBM have announced the final results of a landmark road pricing trial conducted in the Netherlands, which demonstrated that with the help of technology, drivers can be motivated to change their driving behaviour, reducing traffic congestion and contributing to a greener environment. Key findings of the trial included (i) 70 per cent of drivers improved their driving behaviour by avoiding rush-hour traffic and using highways instead of local roads; (ii) On average, these drivers in the trial saw an improvement of more than 16 per cent in average cost per kilometer; (iii) it showed that a clear system of incentives is critical to changing driving behaviour; and (iv) instant feedback provided via an On-Board Unit display on the price of the road chosen and total charges for the trip are essential to maximizing the change in behaviour.
What we have to do is continue to build the case with examples that show the buy in from stakeholders. This is referred to as stakeholder acceptability and is tied up with how the revenue raised is spent. Road pricing can raise significant revenue. The distribution of this money is an important consideration in a road pricing program development, and one which transport professionals, who traditionally struggle to obtain rather than disperse money, may be unprepared to evaluate. Using revenues to fund transportation improvements and broad economic benefits to residents through reduced taxes, rebates or community programs may provide the greatest overall benefit and earn the widest political support. Persons who are much more aware about a definite introduction of road pricing generally develop a more positive attitude towards road pricing than less convinced persons, i.e., the strength of conviction about the introduction of road pricing has a strong effect on the attitudinal evaluation of road pricing. Thus it is clear that we must keep the debate alive in the popular press as well as in the professional outlets – as they say, the more we talk about it the easier it will be to make it happen.
Food for thought
¿Comments? ¿Opinions? ¿Similar News? Send them to us!
Tweet
L.A. Council OKs bus-only lanes along Wilshire Boulevard
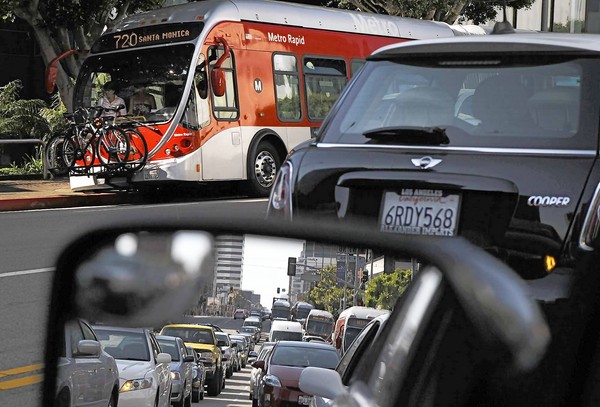
The 7.7-mile stretch between MacArthur Park and Centinela Avenue is expected to cut 11 minutes from the trip. Officials hope to begin construction of the lanes in the summer of 2012 and open them in mid-2013.
Source: Los Angeles Times by Ari Bloomekatz
Wilshire Boulevard, the most heavily used bus corridor in Los Angeles with lines running every couple of minutes and tens of thousands of passengers enduring lengthy and crowded rides, is about to get a facelift designed to bring riders some relief.
To streamline and speed commutes from MacArthur Park to Centinela Avenue at the eastern edge of Santa Monica, the Los Angeles City Council voted Tuesday to construct bus-only lanes along 7.7 miles of that stretch. Officials estimate that it will shave 11 minutes off a nearly one-hour trip.
«It’s a real breakthrough,» said Sunyoung Yang of the Bus Riders Union. «The city has taken a huge step forward to prioritize transit over single-passenger automobiles.»
Yang and representatives of other transit advocacy groups had hoped the council would approve a longer stretch for the bus-only lanes, but still felt the 7.7-mile route was an achievement.
The original proposal called for 8.7 miles of the special lanes, but a one-mile section west of Beverly Hills known as Condo Canyon was excluded after residents and some officials said the lanes would create difficulties for motorists entering their driveways and were not necessary in that section.
When the council approved the 7.7-mile route Tuesday, members made a point of supporting the full route and asking the Metro board to reconsider the Condo Canyon exclusion.
If the MTA does reverse course, the project would return to the council for a new vote. Officials with the city, Metro and the Los Angeles County Board of Supervisors must all approve the same project to be eligible for $23.3 million in funding for the bus-only lanes from the Federal Transit Administration.
The project is expected to cost $31.5 million, Metro officials said, with the remainder coming from other transportation funds.
Councilman Bill Rosendahl and some Brentwood and Westside residents had sought yet another alternative: a 5.4-mile stretch of bus lanes that would stop east of Beverly Hills. But Rosendahl found little support on the council for that proposal.
Some Westside speakers said they were worried that the new lanes would increase traffic congestion and decried claims that they were prejudiced and classist.
«We’re not NIMBY’s, we’re not racists, we’re not against bus lanes,» said Marylin Krell, president of the South Brentwood Residents Assn. «We’re against gridlock,» she said.
Allison Mannos of the Los Angeles County Bicycle Coalition pushed for the full alignment and suggested that those «folks who say congestion will increase should get on the bus» rather than drive cars. Several council members, including Richard Alarcon, said exceptions made to the full alignment were driven purely by political influence.
Brad McAllester, Metro’s executive officer for long-range planning and coordination, said the bus-only lanes would be established on both sides of the street in the current curb lanes — which would be repaved.
Only a half-mile segment would need an additional lane, McAllester said, and there would be other improvements to the corridor such as widening in some areas, restriping, signal improvements and changes to some left/right-turn lanes.
Only buses would be allowed in the designated lanes from 7 a.m. to 9 a.m. and from 4 p.m. to 7 p.m. on weekdays. Officials hope to begin construction of the lanes in the summer of 2012 and open them in mid-2013.
«We’re looking to make the best use of the transportation system as a whole,» McAllester said, adding that officials will look to Wilshire’s success — or failure — to see if similar efforts can work in other places in the county.
«I’m absolutely in favor of it,» said 40-year-old Jason Friedrich, who takes the Metro 720 Rapid from Wilshire Boulevard and La Brea Avenue to work in West L.A. each day. «There’s a huge bottleneck created by traffic coming off and on the 405,» he said.
His morning trip generally takes about 35 minutes, but sometimes after work it can take more than an hour because of traffic, he said.
«This city needs more people on transit,» Friedrich said. «We’re not getting anywhere in our cars.»
¿Comments? ¿Opinions? ¿Similar News? Send them to us!
Tweet
Xiamen BRT to take measures to ease rush hour jam
Source: What’s On Xiamen

According to an online survey on passenger satisfaction released by Xiamen BRT, 90% of the passengers rated the BRT service as ‘crowded’. In order to ease the rush hour jam, Xiamen BRT will take measures suggested by passengers starting from June 15th, reports Strait Herald.
First, LED screens at BRT platforms will be remade. Passenger information systems in LED screens will be distinguished by red, green and yellow. The new information system is expected to be finished in mid-July.
Second, rails will be set up to direct passengers to queue up for the BRT buses orderly.
Third, considering short-distance passengers (1-3 stations) accounting for a large proportion, BRT may raise prices of the short-distance ticket to limit passenger flow volume during rush hours. (It takes less time for short-distance passengers to take buses than BRT)
Fourth, based on passenger flow volume, BRT lines will be adjusted and directly sent to some stations with large passenger flow, such as Xiamen Railway Station (daily highest passenger flow volume: 40,000) in rush hours (7.am-8.am and 5.pm-6.pm).
Finally, some seats will be removed to offer more space for passengers. However, considering long-distance passengers, it is impossible to remove parts of seats in all BRT‘s.
¿Comments? ¿Opinions? ¿Similar News? Send them to us!
Tweet
Transport Economics: An Overview
The relationship between bus contract costs, user perceived service quality and performance assessment
In contract tendering or negotiation there is a growing interest in identifying and integrating user perceptions of service quality into the determination of contract costs. This article develops a framework within which a cost–service quality relationship is quantified, and then implemented to identify benchmark targets for cost efficiency improvements required to achieve a pre-defined service […]
Valuation of Travel Time Savings in WTP and Preference Space in the Presence of Taste and Scale Heterogeneity
A major concern with the derivation of willingness to pay (WTP) distributions from mixed logit models is the incidence of values over a range that are deemed ‘behaviourally questionable’, with respect to the sign and magnitude. Recent research in redefining the ‘space’ within which a choice model is estimated as WTP space, instead of preference-space, has offered encouraging evidence in reducing the range of behavioural implausibility. This paper develops models to compare the empirical evidence when a mixed logit model is estimated with unconstrained distributions on random parameters in WTP and preference space, taking into account scale and the correlation between the attributes. The findings suggest that the gap between the evidence in WTP and preference space narrows significantly when both scale and preference heterogeneity are identified.
Identifying commuter preferences for existing modes and a proposed metro
In 2009, the New South Wales government announced that it would be proceeding with a feasibility study to identify the patronage potential of a new Metro rail system for Sydney. As part of this study, a new modal choice study was undertaken to establish the role of traditional attributes such as travel times and costs (and more recently, reliability) but also somewhat neglected influences such as crowding, where the later has a critical role in the calculation of capacity needs at railway stations. This paper focuses on the commuter segment and develops a new stated choice experiment in which travellers are able to compare the proposed new Metro with existing available modal alternatives for access, linehaul and egress trip stages, with a particular emphasis on the incorporation of crowding represented by the availability of a seat vs. standing in existing and new public transport modes. We present the error component choice model together with estimates of mode-specific willingness to pay for travel time components, service frequency and crowding, that latter expressed in terms of the probability of getting a seat and the probability of avoiding standing.
Embedding risk attitude and decisions weights in non-linear logit to accommodate time variability in the value of expected travel time savings
In recent years we have seen important extensions of logit models in behavioural research such as incorporation of preference and scale heterogeneity, attribute processing heuristics, and estimation of willingness to pay (WTP) in WTP space. With rare exception, however, a non-linear treatment of the parameter set to allow for behavioural reality, such as embedded risk attitude and perceptual conditioning of occurrence probabilities attached to specific attributes, is absent. This is especially relevant to the recent focus in travel behaviour research on identifying the willingness to pay for reduced travel time variability, which is the source of estimates of the value of trip reliability that has been shown to take on an increasingly important role in project appraisal. This paper incorporates, in a generalised non-linear (in parameters) logit model, alternative functional forms for perceptual conditioning (known as probability weighting) and risk attitude in the utility function to account for travel time variability, and then derives an empirical estimate of the willingness to pay for trip time variability-embedded travel time savings as an alternative to separate estimates of time savings and trip time reliability. We illustrate the richness of the approach using a stated choice data set for commuter choice between unlabelled attribute packages. Statistically significant risk attitude parameters and parameters underlying decision weights are estimated for multinomial logit and mixed multinomial logit models, along with values of expected travel time savings.
A simplified bus contract payment formula
World wide history of the development of BRT systems: key systems and policy issues related to BRT
Bus rapid transit (BRT) can be defined as a flexible, rubber-tired form of rapid transit that combines stations, vehicles, services, running ways, and information technologies into an integrated system with strong identity [1]. Complete BRT systems offer fast, comfortable, and low-cost urban mobility [2]. BRT is an evolution of bus priority measures, such as designated […]
PCMC to get consultants to assess impact of BRT
Source: The Times of India
Photo: Wikipedia
PUNE: The Pimpri Chinchwad Municipal Corporation (PCMC) will soon appoint consultants who will assess the impact of the proposed Bus Rapid Transit projects on the industrial township, before and after its implementation. The consultants will monitor and evaluate the project.
The BRT route has been planned on a total of 130 km on various roads in the twin township. Some of the projects have been largely funded under the Jawaharlal Nehru National Urban Renewal Mission.
Besides, the corporation has also proposed to take up the construction of two road-cum-BRT corridors under the Global Environment Facility’s sustainable urban transport project.
The two corridors are Kalewadi KSB chowk to Dehu-Alandi Road (13.2 km), and Nashik phata to Wakad, a distance of 7.8 km. The corporation has availed funds from GEF and International Bank for Reconstruction and Development for improvement of urban transport infrastructure and services.
Civic officials said the consultants will be monitor, evaluate and identify performance indicators for the two GEF-funded BRT corridors.
With the help of performance indicators, the consultants would track the impact of the project before its implementation, during the implementation and also after its completion. The consultants will also be involved in tracking the project to ensure that the objectives of scheduled adherence, cost reduction, efficiency and customer satisfaction are achieved. The consultancy is expected for a period of four years.
Other roads where the PCMC is planning to implement BRT under JNNURM include the Mumbai-Pune highway stretch from Nigdi to Dapodi, Aundh-Ravet Road, Telco Road, Dehu to Alandi road, Nashik phata to Moshi, Hinjewadi to Dehu Alandi road, Vishrantwadi to Alandi and Kiwale to Bhakti Shakti.
While the construction of BRT stations on the Mumbai-Pune stretch has started, the widening of the 14.4-km stretch between Aundh and Ravet has been delayed in some areas due to delays in transfer of defence land to the PCMC.
After the meeting held last week, between PCMC officials and defence authorities to discuss the issue, civic officials said the defence authorities were positive about transferring the land to the corporation.
¿Comments? ¿Opinions? ¿Similar News? Send them to us!
Tweet
Passenger capacity in BRT systems: formula development and application to the TransMilenio System in Bogota, Colombia
Transit textbooks and engineering manuals indicate that the capacity of Bus Rapid Transit –BRT – systems does not exceed 20,000 passengers per hour per direction. The implementation of the TransMilenio BRT System, in Bogotá, Colombia, showed that the systematic combination of multiple platforms at stations, overtaking lanes, level boarding, prepayment, large buses with multiple doors, express and local services, and traffic engineering measures at intersections, allow for very large passenger throughput. Measurements indicate actual throughput of 43,000 passengers per hour per direction with an average bus occupancy of 150 passengers per articulated bus, and a commercial speed of 22-24 km/hour. According to special formulae developed for the analysis of high capacity BRT corridors, the critical section of TransMilenio has a practical capacity of 48,000 passengers per hour per direction with its existing infrastructure and 150 passengers per bus – 35,000 passengers per hour per direction with 110 passengers per bus. Changes in existing infrastructure, such as additional platforms, higher capacity vehicles, non-grade facilities at critical intersections, among other improvements, may increase the capacity, speed, reliability and quality of service of the system.
Chicago Transit Authority (CTA) unveils Bus Rapid Transit plans

Source: RedEye Chicago
Photo: TrippChicago
CTA riders who take a Jeffery Boulevard bus on the South Side could see their commutes shortened by up to seven minutes during rush hour, under the proposed bus rapid transit plans the CTA unveiled Wednesday.
It takes the No. 14 Jeffery Express about 71 minutes, 30 seconds to travel from 103rd Street and Stony Island Avenue to Washington and Jefferson Streets in peak hours, the CTA estimated.
That commute time would be cut to nearly 65 minutes if bus-only lanes were implemented on the South Side of Jeffery Boulevard and buses on that street got priority in traffic over cars, the agency said.
The CTA showcased its bus rapid transit plans at an open house Wednesday in Avalon Park. The CTA was awarded an $11 million federal grant last year to test bus rapid transit on Jeffery Boulevard. The CTA is in the design phase of the project. Construction is expected to take place spring through summer next year with service anticipated to begin in fall 2012.
Antonio Reed of Englewood said it takes him about an hour to ride the No. 14 bus everyday from 95th Street and Jeffery Boulevard to State and Madison Streets.
«I like the project but I’m still trying to figure out what it will look like overall,» said Reed, 19.
Meanwhile, the Active Transportation Alliance, which advocates for walking and bike and transit riding, said it’s on board with the bus rapid transit proposal.
«The new BRT elements that the CTA is implementing on the Jeffery Corridor are exciting improvements to service for riders and a big step forward toward implementing a full-scale BRT network in Chicago,» said Lee Crandell, the group’s director of campaigns.
Among the CTA’s proposals:
- Bus-only lanes: The area between 67th and 83rd Streets on Jeffery Boulevard would be for buses only on the northbound side from 7-9 a.m. and on the southbound side from 4-6 p.m. During the other times, cars would be allowed to park in the lane. Bike lanes are not expected to be implemented for this area.
- New and improved bus shelters: Thirteen existing shelters would be upgraded, including two shelters at Michigan Avenue and Jackson Boulevard. Nine bus shelters would be added between 67th and 103rd Streets on the northbound side of Jeffery Boulevard. The shelters would have Bus Tracker displays, sidewalk ramps accessible for people with disabilities, bike racks and landscape planters.
- Fewer stops on Jeffery Boulevard: On the South Side, many stops would be at major intersections, about a half-mile apart, instead of at every block. The No. 15 Jeffery Local route would supplement service.
- Showcase showdown: A «commercial showcase» station would be built at 71st Street and Jeffery Boulevard. The shelter would have a weather canopy, a farecard vending machine and crosswalk paving. Meanwhile, a «residential showcase» station at 100th Street and Paxton Avenue would have special crosswalks for pedestrians.
- Transit signal priority: Traffic signals between 73rd Street and 84th Street on Jeffery Boulevard would provide an early or extended green light so buses could get through the intersection more quickly. Meanwhile, a bypass lane would be set up on Jeffery Boulevard at Anthony Avenue. A special traffic signal there would allow the bus to go through an intersection ahead of general traffic.
- Bus enhancements: Fifty-three buses from the 103rd Street garage would be updated. Buses could be equipped with Bus Tracker so riders could anticipate transfer and arrival times.
¿Comments? ¿Opinions? ¿Similar News? Send them to us!
Tweet
Bus Rapid Transit: in permanent evolution
Bus Rapid Transit can be defined as a flexible, rubber-tired form of public transport that combines stations, vehicles, services, running ways and information technologies, into an integrated system with strong identity, to offer fast, comfortable and low cost urban mobility. Currently, there are about 120 cities with BRT systems or corridors around the world, comprising about 280 corridors serving about 28 million passengers per day. As of January 2011, about 49 new cities were building systems, 16 cities were expanding their corridors, and 31 cities indicated they were considering BRT.
Opinion Pieces: What if money did not matter?
Opinion Pieces: since 2007, Prof. David Hensher has written an opinion column in the Australasian Bus and Coach magazine, where he monthly discusses a lot of different transport-related hot topics. In this section we are revisiting these columns.
June 2010
I have just returned from Abu Dhabi (AD) as part of a series of meetings with the AD Department of Transport, to develop graduate education training back to Australia for the new generation of planning and policy nationals. What is amazing is the amount of investment in infrastructure, all to be completed by 2030 under the Master Plan, which will involve buses, LRT, heavy rail and metro systems. The Abu Dhabi planners have set themselves the challenge to move the 97 percent modal split in favour of the car to 40 percent in 2030, a challenge I believe will be impossible to achieve. The only bus I saw was a tour bus (see photo) apart from mini vans moving the thousands of ex pat workers shipped in to assist the building frenzy (including knocking down and rebuilding buildings when they reach 10 years – easier than retrofit!). The SUV is still supreme, with no taxes and fuel at 45 cents per litre.
 I gave a lecture on sustainable transport and value for money – in an environment in which money is no object and everything is owned by the Royal family (ies). The mere mention of the need for efficient pricing is such an alien notion when money flows as fast as oil comes up from below the ground. Abu Dhabi has the largest carbon footprint per capita anywhere in the world, and the response in part has been to develop Masdaq City – a zero carbon new city about 26 square kilometers in which cars are banned and the main transport mode is personal rapid transit (PRT), with car parks around the periphery (see the circular car parks in the picture).
 What can we learn from the Abu Dhabi approach? The most interesting lesson is to build excess capacity well out beyond the needs of the planning period which we westerners tend to define as less that 20 years and hence get exacerbated when we fail to allow for growth opportunities. However a warning has to be made – Abu Dhabi really believes in the power of planning and does not recognize that the market will ultimately dictate the outcome – so whether they can get people out of their SUV’s is a big question – providing air conditioned bus stops has been mooted as a solution, but one wonders.
Food for thought
¿Comments? ¿Opinions? ¿Similar News? Send them to us!
Tweet
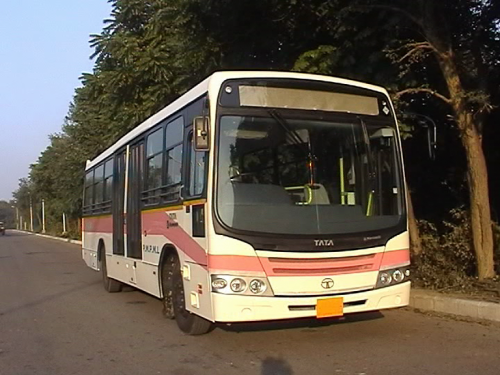
Cities in focus | Indore
Source: EMBARQ
Photo: Gunjan Karun

In 2005, EMBARQ began advising AICTSL (Atal Indore City Transportation Services Limited) on setting up a formal transit agency in the city of Indore. Over time the agency has grown from a fledgling organization with only basic public transportation experience, to a city-wide agency that includes over 250 buses in service, and plans for it’s first Bus Rapid Transit corridor.
EMBARQ continues to work with the city to improve and expand services to meet the needs of the people of Indore.
¿Comments? ¿Opinions? ¿Similar News? Send them to us!
Tweet
EMBARQ Brasil hosts workshop on marketing BRT
Sharing best practices of branding, marketing and communications for improving urban mass transit.
Source: EMBARQ
Municipal transport leaders and communications coordinators from nine Brazilian cities attended a workshop, “Marketing BRT: How to Attract and Captivate Users”, to understand the importance of marketing, branding and communications for the successful planning and implementation of mass transit systems, particularly bus rapid transit (BRT).
The event was held in Rio de Janeiro, Brazil at the South America Convention Center on May 25-26. It was co-organized by EMBARQ Brasil and the Secretary of Transportation of Rio de Janeiro, and sponsored by Fetranspor, a federation of bus operators for the state of Rio de Janeiro. A representative from Fetranspor said the workshop was the best event the federation had ever sponsored.
During the workshop, EMBARQ launched a new publication,“From Here to There: A Creative Guide to Making Public Transport the Way to Go” published in English and Portuguese, to help guide cities and public transit agencies in making mass transit a competitive and desirable alternative to private vehicles. The guidebook presents powerful BRT marketing case studies and generated a significant amount of national press coverage.
Workshop participants included the following transport and communications experts:
- Alexandre Sansão Fontes, Municipal Secretary of Transport, Rio de Janeiro
- Affonso Nunes, Communication Coordinator, Municipal Secretary of Transport, Rio de Janeiro
- Lélis Marcos Teixeira, President, Fetranspor
- Suzy Balloussier, Public Relations, Fetranspor
- Toni Lindau, President, EMBARQ Brasil
- Rejane D. Fernandes, Strategic Relations & Development Director, EMBARQ Brasil
- Richard Katz, Communication Coordinator, EMBARQ Brasil
¿Comments? ¿Opinions? ¿Similar News? Send them to us!
Tweet
MIT Transit Leaders Meeting
On June 16-17, 2011 the MIT Transit Research Group hosted the 4th annual MIT Transit Leaders Roundtable in Cambridge, MA.
Photo: Mikel Murga, Juan Carlos Muñoz, Rosário Macário, Fred Salvucci, Nigel Wilson, John Atanucci
The Roundtable brought together 29 executive-level managers from ten large-city transit agencies from Europe and North America: Massachusetts Bay Transportation Authority (MBTA/Boston), Massachusetts (State) Department of Transportation, Transport for London, Régie Autonome des Transports Parisiens (RATP/Paris), Metropolitan Transportation Authority (MTA/New York), Washington Metropolitan Area Transit Authority (WMATA/Washington D.C.), TransLink of Vancouver (B.C., Canada), Metro Transit of Minneapolis-St Paul, Utah Transit Authority (UTA/Salt Lake City), and the Rhode Island Public Transit Authority (RIPTA/Providence). Also participating in the meeting were several faculty, staff and graduate students.
The Roundtable was held at MIT and generated many lively and interesting discussions. The program was structured using an initial “scene-setting” presentation from an academic or agency perspective followed by short agency state-of-the-practice updates and further open discussions.
The major topics discussed included:
How Can Transit Respond to Higher Demand and More Constrained Resources at the Same Time? Charles Monheim, Chief Operating Officer, New York MTA
Strategies for High Quality Bus/BRT in Major Cities Juan Carlos Muñoz and Nigel Wilson PDF presentation
• What strategies have you used, or do you plan to use, to improve bus service quality in terms of:
– Reserved bus lanes and transit signal priority
– Speedier fare collection
– Increased frequency
– Active headway management (hold or express buses, «leapfrog» operations)
– Timed transfers/network connectivity
• What is the evidence on effectiveness of these strategies?
Innovative Partnering to Increase Ridership and Revenue Fred Salvucci PDF presentation
• Business levy to support transit infrastructure investment: London Crossrail case
• Employer-based monthly transit passes
• PPPs for infrastructure delivery and operation
Emerging IT Strategies George Kocur PDF presentation
• Developing system integration capability versus relying on vendors (make versus buy, in some cases), and how knowledgeable should transit organization be in IT, telecom and other technology areas
• Integration with other municipal IT infrastructure: traffic signal priority, emergency incident management, social service benefit programs, employee IDs (possibly used for payment), road operations (snow removal, etc.), and others
• Open standards/open data. Role of open source and developer community; using performance versus technical interface standards in procurements, others
• Legacy modernization. Shifting resources from legacy maintenance to development of new capabilities and cost reduction.
Advanced Customer Information Strategies John Attanucci PDF presentation
• How are you going about improving customer information (pre-trip and real-time)?
• What is your strategy for maximizing the value of AVL/train tracking data in customer information?
• What is your current and expected future reliance on fixed signs (at stops/stations or in retail activity centers) versus wireless devices?
• Should all real-time operations data be made public, and how do you sort the wheat from the chaff of privately- developed phone apps?
Monitoring and Improving Service Reliability Nigel Wilson and Juan Carlos Muñoz PDF presentation
• How do you measure service reliability?
• What service planning and scheduling strategies (e.g., more layover or recovery time, more or fewer timepoints) are you using to improve service reliability? With what degree of success?
• What operations control and management strategies are you using (dispatch/driver interaction, AVL system displays, or messages to drivers) to improve service reliability? With what degree of success?

![]()
![]()
![]()
¿Comments? ¿Opinions? ¿Similar News? Send them to us!
Tweet
Metrobús, Argentina’s first BRT system, launches in Buenos Aires

Source: ITDP
Photo: ITDP
The public, government officials, and members of the press gathered this morning in the neighborhood of Palermo for the inauguration of the country’s first bus rapid transit system, Metrobús. Mayor of Buenos Aires Mauricio Macri, who was accompanied by City Transportation Secretary Guillermo Dietrich, spoke about the benefits that the 12 km corridor will bring to the city.
“The implementation of Metrobus in Buenos Aires, the first BRT corridor in Argentina, represents significant progress in the development of urban transportation, allowing for an increased quality of life of more than 100,000 people,” said Macri. “Our main goal, as those responsible for urban planning, is to restore the quality of public transportation, for which the support of the W.J. Clinton Foundation and ITDP has been crucial in the process of development and implementation of a world-class BRT system. In the coming years, based on the success of this first phase, we plan to continue the expansion of the BRT network in the City of Buenos Aires.”
Construction on the line was completed in just seven months, showing the huge savings that BRT provides in construction time, cost and logistics when compared to a fixed rail system. The citizens of Buenos Aires now have a new transportation option that connects two commuter rail stations on opposite sides of the city in a trip that takes 40% less time than before.
Metrobús runs along Avenue Juan B. Justo and its 21 stations are served by both articulated and standard length buses. The system includes other standard features of BRT, including physically separated lanes that run in the middle of the street, elevated station platforms and countdown clocks. The city expects the line to draw additional ridership as people adjust to the new system, growing to an anticipated 100,000 daily riders.
“In a remarkably short amount of time the City has helped improve conditions for walking downtown, dramatically increased the availability of high quality bike lanes, and provided a public bicycle system,” said Andrés Fingeret, Director of the Institute for Transportation and Development Policy’s Argentina office and CCI City Director for Buenos Aires. “And now Metrobús will add another high quality transportation option that will get residents where they need to go, quickly, with less pollution and without getting stuck in traffic. We commend Buenos Aires on their continued commitment to sustainable mobility.”
¿Comments? ¿Opinions? ¿Similar News? Send them to us!
Tweet
Marketing BRT in Brazil
Source: The City Fix by Erica Schlaikjer

Photo: Curitiba, by Robert Blackie
“More than 70 percent of people in Rio de Janeiro already use public transportation; most people use buses,” Rio de Janeiro’s Secretary of Transport Alexandre Samson said at the opening session of the “Marketing BRT: How to Attract and Captivate Users” workshop, held on May 25-26 in Rio de Janeiro. “Our biggest challenge is to rationalize and structure the system.”
Bus rapid transit, which originated in Curitiba in the 1970s, remains prominent in Brazil, but its environmental and social benefits are still not fully known or understood by the public.
“BRT must be sold as a product that has importance to the city, not just to the operators or those directly involved, like the manufacturers,” said Lellis Teixeira, president of Fetranspor, a federation of 10 bus syndicates responsible for 81 percent of public transport in Rio de Janeiro. ”It goes beyond that because BRT allows for the re-organization of the entire city.”
IMPROVING CITY LIFE
In the lead-up to the 2014 World Cup and 2016 Summer Olympics, Brazil has been working diligently to upgrade its urban infrastructure, with a special focus on BRT. The country’s rapid economic growth, too, has required massive investments in improving mobility for people living in fast-growing cities. The country already has 20 cities with more than 1 million people.
“We must show the population that the only possible path to quality of life will involve mass transit,” Teixeira continued. “BRT represents a change of paradigm. It will attract car users to public transportation and thus we will save time, lessen the costs of road maintenance, and reduce pollution.”
Marketing the concept of BRT has become even more important now that the city is developing four new BRT corridors, in time for the 2014 World Cup. Undersecretary of Transportation for the Municipality of Rio de Janeiro Carlos Maiolino stressed the importance of continuing to invest in high quality public transport, such as the city’s TransOeste, an east-west BRT corridor currently under construction. Another planned corridor, TransCarioca, will link Barra da Tijuca to the Tom Jobim International Airport.
Many people are still unfamiliar with the concept of BRT, which poses a communications challenge for the local transit authorities.
“The word ‘marketing’ for transport might not even be the adequate word,” Secretary of Transport Samson said. “We have to educate people and clarify and explain to people the benefits of public transportation.”
CASE STUDY OF TRANSIT MARKETING: BUS RAPID SERVICE
Rio has initiated a transport project called Bus Rapid Service (BRS), which borrows some of the elements of BRT, such as segregated bus lanes, in an effort to relieve congestion and cut travel times. Only taxis, emergency vehicles and police cars are allowed to use the corridor. To implement the new system, the city launched a marketing initiative to brand the new corridors and make it easier for passengers to hop on board.
Below is a summary of some of the efforts that were made to ensure the system’s success, as explained by Edmundo Fornasari, the executive director of business for RioCard, a smartcard system used for public transport in the state of Rio de Janeiro:
Small Gestures
Little details make a big difference in establishing customer loyalty. For example, BRS employees distributed roses to women with children on Mother’s Day this year, generating extremely positive feedback from the users. “It was a small experience that shows how you aggregate value,” Fornasari said.
On the Street
BRS staff often go out into the streets to distribute flyers and pamphlets with important information and answer questions from passengers. For example, when some existing bus stops were removed from the corridor during the development of the re-organized routes, BRS deployed its employees to explain how the new changes would affect people’s commutes, especially targeting youth and the elderly.
Open to Feedback
Fetranspor displays a customer service toll-free number behind all its buses to give users feedback on quality of service—and it’s completely voluntary. Fornasari said 80 percent of calls are about trip itineraries and schedules, with some occasional driver complaints.
One Thing at a Time
“You have to promise one thing at a time and you must not make big promises because the public is not prepared for great transformations,” Fornasari said. “If I delivered what I promised, my product is considered good; otherwise I cause frustration.” BRS’s marketing promise was that it would provide more-than-average speed. The promise was fulfilled: average travel times have been reduced by 11 percent to 13 percent.
Emotional Appeal
BRS works conscientiously to incite people’s desire to use public transportation, especially the youth’s, who may one day desire a car, Fornasari said.
The new BRS system does its best to maintain an image of being fast, cheap, clean and safe. BRS distributed pamphlets and advertisements encouraging people to ride a bus down the notoriously long stretch of Copacabana, displaying the iconic lifeguard stations as being very close together. “It was an emotional appeal where we make people feel like Copacabana is smaller.”
At first, Fornasari said, there was some resistance to the name “BRS,” considering they are more accustomed to “BRT.” “People were wondering, ‘What is this? This doesn’t make sense!’ he said. But after some time, and a conscious marketing push, the public’s perception fo the system is improving.
“Regardless of what it means, the name is successful,” Fornasari continued. “This is BRS: the fast bus.”
User-Friendly
Sharing customer service information and data in a simple and visually appealing way is one of the key elements of creating good user information systems.
Before BRS re-vamped the corridors, only 0.29 percent of bus stops had information, Fornasari said. Now, bus shelters include a route map with strong BRS branding, and all buses are clearly identified, with bus lanes clearly painted on the ground.
All these efforts have paid off. Veja, a prominent magazine, wrote a headline: “It’s better to go by bus.” Survey results showed that 14 percent to 41 percent of people like the new buses, and half of those interviewed said traffic has improved very much.
¿Comments? ¿Opinions? ¿Similar News? Send them to us!
Tweet
New study: U.S. recapturing global leadership in Bus Rapid Transit

Source: The City Fix
Photo: Eugene, Ore.’s bus rapid transit, by functoruser.
The Institute for Transportation and Development Policy (ITDP) released an independent study ranking the five U.S. cities on the cutting edge of bus innovation. Titled, “Recapturing Global Leadership in Bus Rapid Transit,” the study rates Los Angeles, Cleveland, Las Vegas, Eugene and Pittsburgh as the cities leading bus-based transportation, mainly due to their implementation of bus-rapid transit (BRT). Though all still in construction, the study also rates San Francisco Bay Area, Montgomery County of Maryland and Chicago as the three cities with BRT systems that have the best prospects of achieving a “gold-standard,” a certification awarded by the international non-profit Gold Standard in recognition of the system’s greenhouse gas reductions. This certification has never been awarded to a U.S. city.
“By far the most important reason for this failure is that U.S. cities have far fewer transit riders and far more private car owners than most of the cities where gold-standard BRT systems have been implemented,” the study explains. “As a result, it is difficult to make a direct comparison between some of the global best practices and the U.S. cases.”
The study also provides a historical analysis of BRT’s in the U.S. and acts as a guideline for cities embarking on new BRT projects. The study explores service planning strategies, infrastructure requirements, design principles, service quality and information-sharing systems to aid cities who are evaluating their current systems or considering implementing new BRT’s. The study also looks at transit integration, like including bicycle lanes, and accessibility, like pedestrian cross-ways, as criteria to create a comprehensive transport system for mass transit riders.
According to ITDP, today’s transit ridership in the U.S. is at a five-decade record high, with buses accounting for more than half of these trips. Yet, there is always room to improve, especially when the nationwide average bus speed is at 12.5 mph. “Passengers must often contend with limited service frequency, and with buses that don’t always run according to schedule,” ITDP explains.
“[BRT] systems are poised to redefine how Americans see and use buses, critical at a time of increasingly scarce transportation funding,” says Walter Hook, ITDP Executive Director. “But based on what we’ve seen in our work in cities around the world, we think there’s still more that could be done. Getting at least one truly world-class BRT system built in the U.S. could inspire cities around the country to rethink the way they use buses in the fight against increasing traffic congestion and rising fuel prices.”
Download ITDP’s study here.
¿Comments? ¿Opinions? ¿Similar News? Send them to us!
Tweet
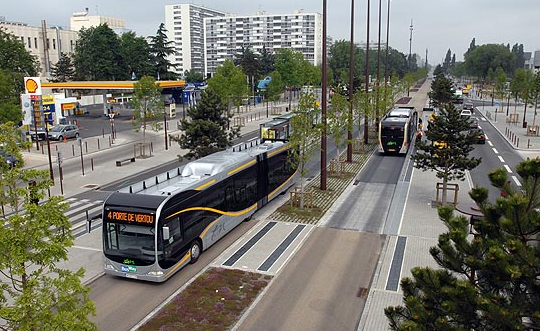
The silly argument over BRT and rail
Source: The Transport Politic by Yonah Freemark
Photo: BusWay in Nantes, France, from City of Nantes
Reserving respect for each mode.
As if operating in parallel, Toronto’s Globe and Mail and The Wall Street Journal each published articles last week describing the merits of bus rapid transit, which each newspaper described as the future of urban transportation.
Both noted that BRT was cheaper to construct than rail lines. Each suggested that in an age of government pull backs and general skepticism over the value of public investment, BRT could offer substantial benefits to a transit system at a reasonable price. And each article concluded with a warning by rail proponents that buses wouldn’t be able to attract people out of their cars.
This is a sensationalized opposition between two modes of transportation that should be thought of as complementary. There are advantages to improved bus service in some corridors, reasons to support rail in others.
What is clear is that for the majority of American cities — excluding only a few in the Northeast — buses will remain the predominant mode of public transit for most riders, even after major expansions in train networks planned for cities from Charlotte to Phoenix. So even cities that choose to invest in rail projects must also spend on the improvement of their bus lines.
Nor is the difference in costs between rail lines and BRT nearly as great as some would argue. The Journal article quotes Dennis Hinebaugh, head of a transportation center at the University of South Florida, saying “You can build up to 10 BRT lines for the cost of one light-rail line.” That might be true if you’re comparing a train operating entirely in its own right-of-way with a bus running in a lane painted on the street. But a streetcar is probably cheaper than a busway. Just ask Hartford, whose busway project will cost $60 million a mile to build.
Just as importantly, the argument made in the Journal by Simon Fraser University Professor Anthony Perl that “Rail has a proven record of being able to take people of their cars; buses don’t,” is quite frankly premised on antiquated views about the differences between buses and trains. A well thought-through BRT line, operating in its own right-of-way, can offer riders most, and sometimes more, of the comfort, convenience, and accessibility of a rail line.
The Globe and Mail notes that “LRT advocates often argue that light rail has better interaction with the streetscape and is a better way of achieving dense, transit-oriented development than BRT,” and indeed, that point is frequently made. But plenty of vibrant neighborhoods in American cities have developed just fine without rail. The City of Seattle, whose first modern light rail line opened in 2009, nevertheless has been densifying for decades, increasing in population from 494,000 in 1980 to 609,000 in 2010 (with no annexation).
The best argument for rail is that it has the ability to provide massive rush-hour passenger-carrying capacity without destroying the city through which it runs. Whether buried in a subway or operating quietly along in grassy medians, trains can be integrated into the public realm without diminishing the pedestrians-friendly qualities all urbanists should hope to encourage. BRT boosters often argue that their mode of choice can carry a similar number of riders, but neglect to mention that this is only possible when buses arrive every 10 seconds along highway-like four-lane corridors. These are conditions that destroy the walking environment.
Fortunately for American cities looking to invest in new public transportation infrastructure, there are few places that demand the passenger-carrying capacity provided by those freeway-based BRT lines in places like Bogotá. In most metropolitan areas, a two-lane busway inserted on an arterial is perfectly appropriate and sometimes even beneficial for a city. Indeed, as we all know, the story that is too complicated for any mainstream paper to explain is that BRT can mean any number of things. The most rudimentary elements of BRT — the nice buses, the well-articulated stops, the traffic signal priority — are basics we should expect from all of our bus lines. Pushing for their implementation along certain corridors shouldn’t arouse much controversy.
But these points are rarely discussed when the argument between modes are made.
The real divisions between bus and rail are political: For those who would fight for improved transit systems in their cities, the truth is that rail projects do certainly have more appeal among members of the public. Thus a billion-dollar rail project may be easier to stomach for a taxpaying and voting member of the citizenry than a quarter-billion BRT line. While the former is qualitatively different than what most car drivers are used to, the latter mode is too easily lumped in with the city bus, which car users have already paid to avoid.
Better transit can come in many forms, but in a country in which the vast majority of people have no contact with public transportation this side of Disney World, making the argument for investments in more buses is difficult, to say the least. BRT is just not sexy until you’ve experienced it. Which is why the considerable success of BRT in South America has not convinced many U.S. cities to abandon their ambitions for more rail.
Articles like those in the Journal and the Globe and Mail, despite their positive assessments of the potential for BRT, nonetheless reinforce the sense that BRT is inferior to rail by putting the two in contrast to one another, rather than focusing on the relative benefits of each. By continuously describing BRT as an economical way to get something like light rail, all that comes across is that it’s cheap.
¿Comments? ¿Opinions? ¿Similar News? Send them to us!
Tweet
Opinion Pieces: Is there a simplified generic payment formula for bus contracts?
Opinion Pieces: since 2007, Prof. David Hensher has written an opinion column in the Australasian Bus and Coach magazine, where he monthly discusses a lot of different transport-related hot topics. In this section we are revisiting these columns.
April 2010
The ongoing commitment to contracting the delivery of bus services through competitive tendering or negotiated performance-based contracts has been accompanied by as many contract payments schemes as there are contracts. With the accumulation of experiences throughout the world, are we in a position to identify a few key features of the diverse suite of payment formulae to establish a simplified and generic payment formula that can capture the great majority of ‘desirable’ characteristics from a social and a commercial perspective?
Talking with many operators and some regulators throughout Australia, there is support for a simplified payment formula; however what this might be is the big question, and the big challenge. What all agree with is the desire to reduce the number of variations that are inextricably tied in with voluminous documents penned by lawyers on what the deal is and is not. The administration and transactions costs are unnecessarily high for all parties. One operator has said to me that an average cost per kilometre is all we need, that sensibly allows for differences across operators that are either not under the control of the operator (e.g., traffic congestion), as well as local environmental restrictions.
Candidate options can be classified as: (i) A pure cost-based model associated with cost per kilometre and no incentives, (ii) A hybrid model based on patronage allocation and residual cost per kilometre without incentives, (iii) a pure cost-based model with incentives, and (iv) a hybrid model with incentives.
A pure cost-based model associated with cost per kilometre is typically a conversion of a total cost, and is determined by operating conditions and efficiency of scheduling. It is often calculated as a function of some key cost sources – operating conditions such as average peak speed, spread of service hours over each weekday and weekend, and vehicle utilisation*, dead running time, fleet financing (although this should be of relevance only under economic deregulation since the contract under competitive regulation should have agreed terms of depreciation, risk and economic life of assets), and scheduling efficiency issues such as layovers between trips, which are often influenced by the degree of union influence in scheduling, but it is likely to affect vehicle scheduling as well.
Patronage and service kilometre incentive payments also exist in a growing number of contracts, and are based on a range of approaches. In simple terms, the patronage incentive payment should be linked to growth in patronage above an agreed benchmark; and service kilometres must be related to some gain in patronage otherwise it is an inefficient cost driver.
One very appealing proposition is as follows:
1. The Authority would define the budget for the services, set minimum standards and a growth target. The minimum standards would be based on passengers per kilometre. Bidders or negotiators would have data on the current services and patronage. If it is a negotiated context then the incumbent is the same as the negotiating operator; if it is a competitive bid then that is not the case).
2. The offers would be in the form of required compensation per passenger. This amount would be indexed for both monetary changes (standard indices) and operating speed (based on average timetabled speed), spread of service hours and bus utilisation, given that these latter three context-specific influences not under the control of the operator are key drivers of the differences in gross cost per service kilometre.
I welcome suggestions from operators and regulators who must be asking similar questions, and hopefully have some clues as to what the answer(s) might be.
Food for thought
* Similar to the cost allocation formula used to use for costing contracts in Britain before competitive tendering, which allocated costs according to three variables – bus km, bus hours and peak vehicle requirement.
¿Comments? ¿Opinions? ¿Similar News? Send them to us!
Tweet
Buses take off, but not everybody is on board
Source: The Wall Street Journal
One of the hottest trends in urban mass transit is—the bus.
Not your old-fashioned bus lines. Cities all over the world are switching to bus rapid transit, or BRT, a modern transit system that combines the flexibility of buses with the speed, comfort and reliability of rail.
With BRT, buses run frequently in exclusive lanes, offering local and express services. Small, technologically advanced stations take the place of the traditional bare-bones bus stop: Vending machines sell fares, slightly elevated platforms make boarding easier, and monitors wired into a Global Positioning System network tell waiting commuters exactly when the next bus will arrive.
Sixteen systems were completed world-wide last year, and 49 more are under construction. Cities in the U.S. and Australia have built BRT systems, but so far there is generally less demand in developed countries. Rather, the trend is most popular in the developing world—especially Asia and Latin America.
«BRT will be an important option for transit systems in the future, especially in cities where transit demand is high and budgets are tight,» says Walter Hook, executive director of the New York-based Institute for Transportation and Development Policy.
The city considered to have the most successful, and first, BRT system is Curitiba, Brazil, with 2.26 million passengers a day and 45 miles of lanes. From three bus corridors in the late 1970s, the system has grown to six, all added in combination with zoning and land-use policies that promoted industrial and residential development.
In the U.S., adoption of BRT has been slow, in part because cars are so prevalent, and because commuters who use public transit have shown a preference for rail. But difficulties in funding new rail projects may make BRT more attractive in the future.
«There will be less dollars available from the federal government for rail, so we’ll see an increase in BRT,» says Dennis Hinebaugh, director of the National BRT Institute at the Center for Urban Transportation Research at the University of South Florida, in Tampa. «You can build up to 10 BRT lines for the cost of one light-rail line.»
To date, five U.S. cities use BRT for parts of their public-transit systems. Los Angeles has a BRT system that comprises about 14 miles; Cleveland, seven miles; and Eugene, Ore., four miles. Eight to 10 other systems are under consideration, including routes in San Francisco and Chicago, according to the Institute for Transportation and Development Policy.
But BRT critics say that just because the systems are successful in Latin America and Asia doesn’t mean they’re the best option in the U.S.
«Rail has a proven record of being able to take people out of their cars; buses don’t,» says Anthony Perl, professor and director of urban studies at Simon Fraser University in Vancouver, British Columbia.
Still, Mr. Perl says BRT could make sense in North America if it were implemented by converting lanes in existing roads to dedicated bus lanes. «I’m for taking road space and using it more efficiently, but not building roads,» he says. «If we talk about building, I think you might as well build rail.»
¿Comments? ¿Opinions? ¿Similar News? Send them to us!
Tweet
Pune BRT: Recreating a vision
Source: ITDP
Pune, cultural capital of Maharashtra, has begun to develop a new, robust public transport system in the form of Bus Rapid Transit (BRT). The Pune metropolitan region is comprised of two municipal corporations—Pune and Pimpri-Chinchwad—with a population of over five million. The twin cities face a daunting challenge: how to preserve sustainable and equitable mobility when hundreds of new cars and motorcycles are being registered in the city daily. According to the Pune Municipal Corporation (PMC) Environment Status Report 2009–2010, the city now has 473 private vehicles for every 1000 people, but only one bus for every 6,250 people!
Citizens and the administrations of the two municipal corporations have voiced concerns over the future mobility needs of the region and BRT systems are increasingly being recognized as a key solution. It is also essential to ensure safety for pedestrians and to provide dedicated lanes for cyclists, who compete for road space with a rapidly growing number of motor vehicles.
ITDP is advising and assisting the Pimpri-Chinchwad Municipal Corporation (PCMC) in BRT planning and design. ITDP is also working with the Pune Mahanagar Parivahan Mahamandal Limited (PMPML), the municipal public transport agency, on the planning and structuring of public transport operations with an emphasis on BRT.
PCMC’s four BRT corridors, funded in part by the central government’s Jawarharlal Nehru National Urban Renewal Mission, measure a total of 50 km and will be built with median stations and high quality pedestrian and cycling infrastructure. Nearly 500 new buses with unique specifications are being procured for Pune and Pimpri-Chinchwad.
Today, PMPML has a fleet of 1,200 buses on a 1,900 km network, that carries over one million trips per day. The regular buses are subject to traffic delays, leading to irregular and infrequent schedules. There is a unique opportunity to restructure PMPML’s 331 existing bus routes to increase service frequencies on the busiest corridors while making the route network more legible for new customers.
¿Comments? ¿Opinions? ¿Similar News? Send them to us!
Tweet
In Washington, exploring a sales tax for BRT funding
Source: The City Fix
Photo: C-Tran
The board of directors of C-Tran, the transit agency that serves Clark County in Vancouver, Wash., voted to add a ballot measure for a 0.1 percent sales tax increase to fund the proposed bus rapid transit (BRT) project, the Oregon Live reports. The ballot measure will be up for voting either in the upcoming August or November 2012 elections. However, it’s not clear who in Clark County will be able to vote on the measure.
“The three Vancouver city councilors on the board, however, blocked language that would require the vote include all voters in the C-Tran district, under threat of a block veto,” the article explains. “That leaves open the possibility that the agency could form a smaller subdistrict to vote on the measure and within which the tax would be collected.”
But Vancouver Mayor Tim Leavitt suggests pausing on the subdistrict idea until the district voters decide on core bus funding in the November vote. “We’ll have a better idea then of what kind of support we’re going to have in our community for public transit,” Leavitt said.
C-Tran’s BRT Project is still in its early planning and development stages. The project, known as “the Fourth Plain BRT,” is mainly an effort to improve economic development opportunities along the proposed corridor and connections to and from neighborhoods and job centers. The project is less about traffic congestion and more about addressing slow bus speeds, poorly managed passenger vehicle access, inadequate bike and pedestrian facilities, and economic revitalization, according to the project’s website.
The BRT proposal comes at a time when the C-Tran district projects a 30 percent to 40 percent population and employment increase in the corridor by 2030, which would also cause an increase in traffic in the next 20 years. Accordingly, the project forecasts an increase in transit ridership and transit run times, which ultimately would degrade transit performance and schedule.
Based on the projected statistics and the unique needs of Clark County, the Southwest Washington Regional Transportation Council (RTC) completed a two-year Clark County High Capacity Transit (HCT) System Study and recommended the BRT as a preferred solution to serve the transit needs of the county and connect its residents to nearby Portland, Oregon. The BRT was concluded as the best solution based on cost effectiveness, ridership and potential environmental impacts, the project’s website explains.
In an effort to further investigate the feasibility of the BRT, C-Tran hired Parsons Brinckerhoff, an international infrastructure development and operations firm, in a $1.5 million project to study and advise on alternatives leading up to the funding vote, Oregon Live reports.
“[Parsons Brinckerhoff] will meet with community groups to determine what a bus rapid transit line and the stations along it might look like,” the article says. “It will also study alternatives, including changes to existing bus service. The firm will also examine the potential environmental impacts of the project to ensure it meets federal and state regulations.”
Chuck Green, C-Tran’s BRT project manager, explains that the firm’s study could provide information on how to make traditional bus service more efficient, which would be worth the cost even if C-Tran chooses not to pursue the BRT.
The early estimates expect the BRT project to cost $2.1 million, of which 80 percent will be paid by a Federal Transit Administration grant. C-Tran will be responsible for the remainder of the cost.
¿Comments? ¿Opinions? ¿Similar News? Send them to us!
Tweet
MyCiTi buses start rolling in Cape Town
Source: ITDP
The second week of May, Cape Town unveiled the first phase of the MyCiTi bus service, between Table View and the Civic Centre, on its Integrated Rapid Transit System. The new service is already transforming the way residents view buses. The bus is a salve to many who previously dealt with a complicated network of taxis, buses and rail. One passenger, whose commute was reduced to only 30 minutes, commented, “I used to sit in traffic for two hours…I’m falling in love with the bus already”.
City officials have also praised the system, saying that it will improve the city’s transport system and lessen traffic congestion. However, ANC Mayoral Candidate Tony Ehrenreich, would like to see more priority given to extending the service to the city’s poor, who travel from Khayelitsha and Mitchells Plain (the largest townships outside of Cape Town) on over-crowded trains and buses.

The launch follows lengthy negotiations with the local taxi operators, a similar situation that Johannesburg’s Rea Vaya experienced. A contract was finally signed on Sunday May 8, less than a day before the My CiTi launch. ITDP has played a critical role in the business and financial planning for the system.
¿Comments? ¿Opinions? ¿Similar News? Send them to us!
Tweet
Bus Rapid Transit: State-of-the-art in performance and benefits
BRT short course at ITLS – University of Sydney
Date: Wednesday 29 June 2011 8.45am-12pm
Cost: Free (limited places)
BRT is delivering high quality public transport efficiently in cities around the world. How can Sydney benefit from this innovative form of public transport?
ITLS Visiting Professor John Nelson will present a half-day short course highlighting recent developments in BRT including state-of-the-art in performance and benefits.
Professor David Hensher will introduce the short course by showcasing our ALC-BRT Centre of Excellence development, of which ITLS is a partner.
Download full program here.
¿Comments? ¿Opinions? ¿Similar News? Send them to us!
Tweet
Smartmatic signs deal for Bus Rapid Transit in Cartagena, Colombia worth US$370 million
Source: Green Technology World

Cartagena, the most important touristic and cultural district of Colombia, selected joint-venture partners Smartmatic and Dataprom, for the task of implementing and operating an automated fare collection and fleet management system for the new Integrated Mass Transportation System, targeted for a service life span of the next 18 years.
The financial, technology and management services which Smartmatic will supply to the transit authority Transcaribe will cover the city of Cartagena and surrounding municipalities. It will comprise a number of advanced systems, including a fare collection system based on the latest and most secure smart card payment technologies, a real-time fleet management and control system for public transportation buses, a passenger information system, and fare card vending machines, with access locations spread throughout the territory for the convenience of passengers. The system is expected to be operational in 2012.
«We are overly pleased at having been selected by the Colombian authorities to bring our contributions and expertise to their transportation system. It is Smartmatic’s commitment to keep working to help create the future smart cities, and also to create a better and farther-reaching quality of life,» stated Antonio Mugica, Smartmatic’s CEO.
According to Transcaribe, the adjudication was a result of a cmpetitive offer, after a highly demanding public bidding process. The winning consortium, led by Smartmatic, submitted the proposal with the best price and most sustainable solution, designed and adapted to the specific challenges presented by Cartagena, and thus received the highest score out of five bidders. The proposed price will translate into savings of more than US$30 million, which can be destined to health and other social investments, among other specific benefits.
Dataprom, a Brazilian company specializing in advanced transportation systems, has an impressive track record in transit systems in Brazil, including the world-renown implementation done in the city of Curitiba, which has become an international reference when it comes to modern, smart, and sustainable public transportation systems. Further, Smartmatic, a supplier of cutting-edge technological solutions, has ample experience in the development and implementation of high-volume transactional platforms and in the deployment of mission-critical projects having a significant social value for citizens. This partnership heralds a successful project, and a first-class automated transport system.
Cartagena is a relevant economic centre in the Caribbean, the most important touristic destination and cultural district of Colombia, as well as the country’s fifth largest city. The port, fortresses and monuments of the Colonial City have been declared by the UNESCO as a World Heritage Site. With the new BRT, both residents and visitors will benefit from an automation solution toward modern, efficient and safe public transportation.
About Smartmatic
Smartmatic is a multinational company that designs and deploys technological solutions aimed at helping governments fulfill, in the most efficient way, their commitments with their citizens. It is one of the largest cutting-edge technology suppliers, with a wide and proven experience in the United States, Asia, Africa, Latin America and the Caribbean. Smartmatic’s competitive advantage lies in its cutting-edge technology and its experience in three key areas: Elections, Identity Management and Smart Cities (Public Transportation, Citizen Security, and Census).
About Dataprom
Dataprom Computer Equipment and Industrial Services is a company with 22 years of experience in the development and design of intelligent technology solutions, associated with the quality of life of citizens. Dataprom uses the latest technology in all production processes and operations, complying with its values and mission towards developing innovative products that meet the needs of its customers.
¿Comments? ¿Opinions? ¿Similar News? Send them to us!
Tweet
Opinion Pieces: The most powerful instrument for decision making – people’s opinions
Opinion Pieces: since 2007, Prof. David Hensher has written an opinion column in the Australasian Bus and Coach magazine, where he monthly discusses a lot of different transport-related hot topics. In this section we are revisiting these columns.
March 2010
For some time I have felt a need in Australia to have a regular survey of the opinions of residents of Australia in regards to transport. We have ongoing surveys of consumer sentiment (e.g., the Westpac survey), but no record of how society views developments or the lack thereof in the provision of transport infrastructure and services. ITLS decided to do something about this and in 2009 we developed a methodology, joined in partnership with Interfleet Technology and launched the quarterly survey on March 23rd. In time we can build an informative and influential profile of opinions every 3 months from a sample of residents throughout the country on transport matters that they have views on.
Transport Opinion Survey interviews are conducted by Taverner Research by telephone using trained interviewers. Telephone numbers and the household response are selected at random. The quarterly survey is based on 1,000 adults aged 18 years and over, across Australia. This survey was conducted over 13-28 February 2010. The data reflect Australia’s population distribution.
What did we find in the first quarter 2010?
- Over half of Australians (58%) say the highest priority issue for transport in Australia is public transport improvements, more than twice as many as road improvements (23%).
- Less than one in five Australians (19%) think transport in their local area has improved in the last year, with NSW residents the least positive.
- Only one in five Australians (20%) think transport in their local area will be better in one year’s time, with about half thinking it will be the same as now. Victorian residents are most confident transport in their local area will be better in one year’s time.
- A quarter of Australians (25%) think transport in Australia will be better in one year’s time than now, while slightly more (27%) think it will be worse. NSW residents are the least confident of any state, while South Australian residents are clearly the most confident about transport improving.
- Australians are more confident that transport in Australia will be better in 5 years than in 1 year, with almost half (46%) thinking transport in Australia will be better in 5 years. NSW residents are the least confident of any state.
- 53% of Australians think their state government is most responsible for transport with West Australian residents most likely to nominate their state government as responsible (60%), and South Australian residents least likely (43%). 27% of Australians nominate both the state and Australian federal governments and only 14% nominate the Australian federal government.
- 44% of Australians think the private sector should be more involved in the provision of public transport, while 29% think the private sector should be involved less. NSW residents were noticeably more positive than Victorian residents on private sector involvement in public transport.
Since the readers are public transport people you will be interested in the following graph.
What do you think is the highest priority issue for transport in Australia now?
![]()
Food for thought
¿Comments? ¿Opinions? ¿Similar News? Send them to us!
Tweet
Crowding and public transport: A review of willingness to pay evidence and its relevance in project appraisal
This paper reviews public transport crowding valuation research, using a number of primary studies conducted in the UK, USA, Australia and Israel. We identify three measures used to value crowding (a time multiplier, a monetary value per time unit and a monetary value per trip), and associated ways of representing crowding in stated preference experiments. Although a number of different types of crowding in terms of location are identified, namely in-vehicle, access-way, entrance and platform/station, the majority of reviewed studies investigate only in-vehicle crowding. Despite the different characteristics of the reviewed studies, they all report that crowding would increase the value of travel time savings, which can be viewed as an additional component of generalised time. This paper also comments on the role that the WTP for crowding reduction can play in project appraisal, and suggests some important avenues for future public transport crowding valuation research.
Designing an express service for a bus corridor in Santiago, Chile
In transit systems with high demand levels, the use of express bus services that serve only a subset of stops along certain routes would seem to be a promising alternative given the benefits they offer to both users and operators. For users, express buses mean improved service levels in the form of lower travel times due to fewer stops and higher between-stop speeds, while for system operators they enable demand to be met with fewer vehicles thanks to shorter bus cycles.
In this article we present a work aimed at designing an express service to operate over a given corridor in Santiago, Chile in conjunction to another one that would serve every bus stop on the corridor (i.e. an all stop service). To do so, we had access to origin destination trip matrices between bus stops during the morning peak, and the off peak periods. These matrices were used to construct diverse demand scenarios for the corridor based on our expectations of the change that the new express service would cause.
Based on the studied scenarios we propose two different express services, one for the peak hour and one for the rest of the day. Results suggest that implementing these services would reduce social costs when compared to a solution where the corridor is served by a single all stop line. Users that make long trips would be the most favoured from this decision. We also conclude that the longer the trips and the larger the demand, the higher the benefits obtained from operating an express service.
Development-Oriented transit: Minimizing taxpayer investments, maximizing community value
Source: The City Fix by Mark Huppert
There is a lot of talk throughout the United States about transit-oriented development (TOD). The term describes the planning of private development around station areas for new transit system investments, a process that often involves some form of public-private partnership to achieve the goal of adding density of housing, jobs and services around station nodes. In some U.S. cities, TOD is fraught with complications due to the often conflicting goals of the transit agency, the local governing jurisdictions and private developers. For example, the Seattle transit agency Sound Transit is investing $16 billion in capital costs for a second phase of regional rail investments, but the level of density achieved in station areas is often lower than the market potential due to concerns of neighbors and lack of vision and leadership to fully address long-term regional growth trends and needs.
![]()
The Sound Transit LINK Light Rail at Othello Station in Seattle. Photo by Seattle Transit Blog.
The strategic error of conventional TOD is that the business model often completely neglects the importance of creating a built-in, long-term customer base for the taxpayers’ massive capital investment. Instead, project sponsors often cave to the pressure of a small minority of vocal individuals, rather than looking out for the good of the transit ballot community and the economy at large. The result of this surprisingly short-term focus for such massive, long-term public investments is an unrecoverable, lost economic opportunity. Communities spending billions of dollars in new rail investments are left with few ways to finance the non-transit infrastructure required to make the necessary new density at transit nodes livable.
Without enough customers, new measures will often fail, or perhaps even worse, the costs to taxpayers of the approved transit investments will skyrocket over time.
PUTTING DEVELOPMENT FIRST
In Hong Kong, where station-area planning has dominated the development landscape for more than three decades, the region’s public agencies and developers face the opposite of the lost opportunity problem. Driven by a much different land ownership scheme, where government owns nearly all land and sells development rights to private companies on a land-lease basis, the dominant concept is not transit-oriented development but development-oriented transit.
There is a lot of discussion about the development around rail stations in Hong Kong, as sky-high towers above dense retail podiums are springing up atop rail stations throughout the city. The intensity of use achieved through the development-oriented financing scheme appears to be the ultimate manifestation of good planning practices, but the outcome of these developments are seeing mixed reviews. The partnership typically works like this:
- Mass Transit Rail (MTR) Corporation, a privatized company since 2000, buys the land from the government via a bifurcated long-term lease consisting of an up-front capitalized lease payment and an ongoing percentage of revenue lease payment.
- MTR develops a rail station.
- MTR builds private commercial and residential towers above the station.
The towers above the rail stations house high-end shopping malls, hotels, restaurants, housing and more. Profit from these private developments offsets the capital cost of the station development. Therefore, the only expense left for the stations is the cost of day-to-day operations. It’s a financially sustainable transit option—practically unimaginable in North America. The relatively small ongoing costs, paired with the increase in rail customers served by the new stations, results in surprisingly cheap fares for rail users. The low cost to users is an added bonus to riders and a key to the system’s success.
URBAN “CATHEDRALS”
The primary measures of project success used by the transit agency and local government are the amount of agency revenues, in both the short and long run, that are received from the overall development activity (transit infrastructure + private development) and the number of system customers that can be accommodated in the new station area with supporting housing, jobs and services. The end result in the urbanized areas of Hong Kong is often huge, multi-story station podiums filled with retail and services, coupled with large towers of residential and commercial uses.
Architect Eugene H.K. Leung, who researched the podium developments as a graduate student at the Chinese University of Hong Kong, calls the station nodes “the new cathedrals of the city” because they become centers around which development occurs and communities congregate. As the importance of these developments in the city’s urban fabric continues to grow, the controversy around them is magnified. These monolithic structures are extremely productive financially for the transit agency, the local government and the developers. However, more often than not, these mega-projects fail to meet the needs and goals of individuals who interface with the project at the pedestrian level.
 According to Dr. Sujata Govada, a leader in Hong Kong’s urban design community, the block-style mega-developments — particularly those that swallow up existing portions of granular street grid — have been a major cause of the Hong Kong population’s awakening interest in planning and urban design. Activists in this realm range from academics like Leung, to industry professionals, to neighborhood concern groups. While that’s not unusual for U.S. cities, where public comment processes are often fundamental to land use (and “NIMBY-ism” is often a stubborn roadblock to innovative development and land use), it’s something of a breakthrough for Hong Kong, where opposition to development has historically been seen as opposition to progress and economic growth.
Stakeholders from various backgrounds are working to answer one fundamental question: how might two seemingly irreconcilable approaches to the same basic problem be resolved?
Photo: Union Square at Hong Kong MTR Kowloon Station, by jimbowen0306.
CUSTOMER-CENTRIC
The remedy might be as simple as re-framing the goals for these types of developments. In his master’s thesis, “Transportation Hub as the New Urban Center,” Leung proposes just such a solution. He suggests adding another metric to the conventional, financial success criteria of the development-oriented transit project: permeability of the public pedestrian zones at the station podium. Rather than having the podium act as a fortress against the surrounding neighborhood, as is the case at many of Hong Kong’s most urban stations, Mr. Leung’s solution creates a net to draw in people from the community surrounding the project.
Whatever the dominant framework for planning development around transit—whether it is the U.S. model or the model prevalent in Hong Kong—this emphasis on the internal and external customers of a development allows success to be realized by the greatest number of project stakeholders. A permeable design fortifies the fabric of the neighborhood as a whole, which fulfills an important function of TOD. Meanwhile, the economic opportunity to minimize the taxpayers’ share of the transit investment is still fully realized through maximizing the value of land development rights sold or leased to private parties within station areas. The ultimate outcome of this customer-centric approach to station area planning should be lasting sustainability for TOD investment financially, as well as socially.
¿Comments? ¿Opinions? ¿Similar News? Send them to us!
Tweet
The 20 best and worst cities in the US for public transit
With gas prices rising and family budgets strained, more commuters are looking for efficient ways to get to work without a car. But are America’s transit networks up to the task? To find out, the Brookings Institution analyzed 100 metro areas in the U.S. to see which cities are getting it right and which aren’t.
Source: TIME
With gas prices rising and jobs still scarce, more commuters are looking for efficient ways to get to work without a car. But are America’s transit systems up to the task? To find out, the Brookings Institution looked at U.S. public transportation systems in the nation’s 100 largest metro areas and analyzed which cities were best at getting their residents to their workplaces in a timely and cost-effective manner. By researching coverage, service frequency and percent of total employed residents who can use public transportation, the report aimed to rank cities based on the most convenient overall commute. Take a look at the 20 cities with the best and worst job access via city transit systems — the number one metro area might surprise you.
Best Cities:
| Region | Percent of working-age residents near a transit stop | Median wait (minutes) for any rush hour transit vehicle | Percent of jobs reachable via transit in 90 minutes |
| 1. Honolulu, Hawaii | 97% | 9.0 | 60% |
| 2. San Jose-Sunnyvale-Santa Clara, California | 96% | 6.9 | 58% |
| 3. Salt Lake City, Utah | 89% | 8.5 | 59% |
| 4. Tucson, Arizona | 73% | 9.2 | 57% |
| 5. Fresno, California | 72% | 10.7 | 57% |
| 6. Denver-Aurora-Broomfield, Colorado | 84% | 8.1 | 47% |
| 7. Albuquerque, New Mexico | 73% | 14.0 | 53% |
| 8. Las Vegas-Paradise, Nevada | 86% | 11.1 | 44% |
| 9. Provo-Orem, Utah | 73% | 14.1 | 48% |
| 10. Modesto, California | 90% | 18.0 | 38% |
Worst Cities:
| Region | Percent of working-age residents near a transit stop | Median wait (minutes) for any rush hour transit vehicle | Percent of jobs reachable via transit in 90 minutes |
| 1. Knoxville, Tennessee | 28% | 18.3 | 25% |
| 2. Riverside-San Bernardino-Ontario, California | 77% | 16.3 | 8% |
| 3. Youngstown-Warren-Boardman, Ohio | 36% | 27.0 | 14% |
| 4. Augusta-Richmond County, Georgia | 30% | 27.9 | 16% |
| 5. Palm Bay-Melbourne-Titusville, Florida | 64% | 38.4 | 7% |
| 6. Poughkeepsie-Newburgh-Middletown, New York | 46% | 51.0 | 8% |
| 7. Birmingham-Hoover, Alabama | 32% | 24.1 | 23% |
| 8. Greenville-Mauldin-Easley, South Carolina | 28% | 28.3 | 29% |
| 9. Richmond, Virginia | 31% | 13.7 | 27% |
| 10. Atlanta-Sandy Springs-Marietta, Georgia | 38% | 10.2 | 22% |
See the full Brookings report.
¿Comments? ¿Opinions? ¿Similar News? Send them to us!
Tweet
Urban transport: A little less conversation, a little more action

Professor David Hensher, Director of ITLS, discusses transport priorities for New South Wales* (NSW) over breakfast in Sydney with 150 people – 16 May 2011
Source: ITLS News & Events
Over 150 people attended the Powered by Research Breakfast hosted by The University of Sydney Business School and held at Cockle Bay Wharf. For the recently elected NSW government, urban transport remains a priority challenge. At the breakfast forum ITLS Director, Professor David Hensher, presented his research on whether an increase in funding for public transport is the best way to see a significant improvement to traffic congestion. Professor Hensher noted that over 80% of trips in Sydney are currently made in motor vehicles and questioned whether significant modal changes will be made achieved unless the government addresses pricing the use of cars to reflect the cost they’re imposing through congestion. Professor Hensher emphasised the need for a commitment to networks and systems, the state of public transport, funding sources, special funding instruments, and the User Pays system.
Professor Hensher’s address was followed by a lively panel discussion with Paul Forward, Principal of Evans and Peck (former CEO of the NSW Roads and Traffic Authority), and Andrew West, Senior Journalist at the Sydney Morning Herald. The panel was chaired by Helen Dalley, best known as the presenter of Sunday, the Today Show and A Current Affair on the Nine network, and now the host of Sky News Sunday Business.


Download full video of event.
Download Professor Hensher’s presentation.
* New South Wales (abbreviated as NSW), is Australia’s most populous state, and is located in the south-east of the country, north of Victoria, south of Queensland, east of South Australia, west of Jervis Bay Territory and encompasses the whole of the Australian Capital Territory. Source: Wikipedia.
¿Comments? ¿Opinions? ¿Similar News? Send them to us!
Tweet
Impact of design elements on the capacity and speed of Bus Rapid Transit (BRT): the case of a single lane per direction
Despite its booming growth, the BRT industry is still far from reaching maturity. As trial-and-error and empiric techniques were largely used as insights for innovations in design, some BRT systems achieved great successes in terms of performance and became world-class flagships whereas others would be most properly classified as busway systems requiring major improvements. In this paper we explore the performance of a single lane per direction no-overtaking BRT corridor, in terms of capacity and operating speed, by conducting a design of experiments that comprised the simulation of 324 alternative scenarios. In the simulation runs we varied demand levels, boarding and alighting rates, spacing of stations, vehicle loadings, quantity of berths per station, and traffic signal positioning in relation to stations. The qualitative analysis reveals that such a BRT system can achieve a capacity around 15,000 pass/h/dir along its critical section with an operating speed of 20 km/h. Preliminary statistical analysis enabled the estimation of a regression model representing the impact of BRT design elements on the operating speed. Our findings provide useful insights for designers of high-performance BRT corridors.
Transit ridership up due to rising gas prices
Source: AltTransport by Joseph Cutrufo
It was only a matter of time: Transit agencies are reporting increased ridership in USA due to higher gas prices.
With the national average for a gallon of regular unleaded now at $3.98, motorists across the nation are switching to public transportation. We saw it in 2008, when the national average reached $4, and we’re seeing it all over again.
According to the American Public Transportation Association, $4 per gallon is the tipping point where people begin to drive less and use transit more – a lot more. If gas prices stay this high, we can expect an additional 670 billion transit trips made this year nationwide.
In Boston, transit ridership is up 5 percent overall, with 7 percent increases on rapid transit lines. Highway and airline traffic are also up, but this is mostly attributed to the recovering economy.
The Gold Line, a light rail line that connects Pasadena, CA to Union Station in Downtown Los Angeles, saw a 10 percent increase in ridership in March 2011 over March of 2010. Transit officials expect even higher ridership as the area’s 12 percent unemployment rate goes down and people head back to work.
It’s not just in big cities with subways and light rail where travel behavior is changing. In Wichita, KS, ridership is up 5 percent despite a recent $.25 fare increase. Wichita Transit expects even more new riders when the average gas price hits $4 a gallon there.
Ridership is up 4.7 percent in Wilkes-Barre, PA in the first quarter of 2011 compared to the first quarter of 2010. The Luzerne County Transit Authority secured a flat $2.56 per gallon price on diesel that will last through June, and they’re replacing older buses with diesel-electric hybrids in 2012.
In McAllen, TX, it’s not just gas prices but also flashy new lime green buses and cheap fares that transit officials are giving credit for increased ridership in 2011.
With all this increased ridership nationwide, let’s hope a transit-friendly transportation bill passes. It’s probably not a good idea to slash funding for public transportation when we have so little control over the cost of the alternative.
¿Comments? ¿Opinions? ¿Similar News? Send them to us!
Tweet
Can the clean development mechanism bring Bogota's 'surface subway' to your city?
Source: E&E Publishing by Nathanial Gronewold
BOGOTA, Colombia — A 10-year public transit project here has fast become a model for developing cities the world over. But could it next be the model for a major expansion in international carbon offsetting efforts?
Fully operational from 2001, the TransMilenio service is famous as an ideal bus rapid transit system, an innovation that by some estimates is roughly 1,000 times cheaper than building a subway. The model is now being copied elsewhere in Latin America, Africa, Asia and even the United States.
Less well-known, TransMilenio was the first public transportation project in the world to win U.N.-approved greenhouse gas emissions offset credits. Developed in tandem with the United Nations’ Clean Development Mechanism (CDM), the methodology for counting the climate change-combating benefits of mass transit was designed with TransMilenio in mind. It is now being adopted by other municipalities eager to trade reduced carbon dioxide emissions for CDM cash.
Alone just a few years ago, TransMilenio is now one of six registered CDM transportation projects, with 36 more in the works. Advocates are hoping that hundreds more will follow, eager as they are to spread the benefits of carbon reductions, cleaner air and smoother commuting in rapidly expanding developing-world cities while simultaneously reducing the dominance of China, India and Brazil in the CDM.
But some say that the slow growth of transportation projects in the CDM shows why one of the best options for diversifying the geographic spread of these international carbon offsetting projects may fail to live up to expectations.
Daunting paperwork needs to be simplified
While some see transportation becoming one of the fastest-growing areas of the CDM, others knowledgeable of Bogota’s experience doubt that such projects will ever expand in number beyond the handful that exist today. The complexity of counting the avoided CO2 from reduced car trips, policed rigidly by U.N. regulators eager to avoid fraud or scandals, is too great for many city governments to bother, they say.
«If you don’t simplify the process, you will have large projects come for it, but they will be a minority of projects,» said Jürg Grütter of Grütter Consulting.
Grütter’s firm helped Bogota with its CDM application and is busy with other projects around the world. It aided with the second successful transportation applicant to the CDM, a bus rapid transit system in Guangzhou, China, and has team members in India, Brazil and Vietnam.
But in an interview, Grütter complained that the hurdles such projects have to go through to win the CDM credits, known as Certified Emission Reductions (CERs), are so numerous that they will never proliferate at the rate that the most optimistic proponents would like.
Aside from the difficulties of proving that projects need the CER income to be viable, the costs and complications from counting and tracking the cuts in CO2 levels attained make it likely that most developers will choose to stay away from the CDM, he and his team believe. Counting emissions reductions from thousands of tailpipes, it turns out, isn’t nearly as straightforward as dealing with a single source.
«When the public sector is involved, they are very fearful of this type of contract,» Grütter said. «It’s much more difficult to define the product and define the quality and to define what you are in fact contracting.»
The operators of the Bogota system themselves, however, are more optimistic that CDM administrators and public transit advocates can find the right balance. The reason, they say, is that every time they host a foreign delegation on a tour of TransMilenio, they are asked in detail how they managed to secure CDM financing for the project.
«That is one of the top presentations that we have,» said Arturo Fernando Rojas Rojas, deputy general manager of TransMilenio, in an interview.
Designated bus lanes unsnarl traffic
With more than 50 miles of designated bus lanes separated from the normal traffic flow, TransMilenio is still the largest bus rapid transit, or BRT, system in the world, though it’s modeled after a much older one in Curitiba, Brazil.
The concept is often called «surface subway» by its proponents.
Using streets freed from passenger vehicles, pre-boarding fare payment systems and transfer stations, bus rapid transit operates very similarly to a rail system but is much less expensive, relying largely on existing infrastructure. Transportation experts say it costs roughly $1 billion to build a mile of below-ground subway track in the United States, whereas costs for bus rapid transit are put close to $1 million per mile.
Commuters say that within the past decade, TransMilenio has managed to tame Bogota’s famously snarled city traffic, especially the notorious congestion on Caracas Avenue. A trip that once took an hour and a half is now estimated to last only 45 minutes using the buses. Green «feeder buses» deliver passengers to the main stations, where they can board the articulated red buses on the physically separated lanes.
To date, Rojas estimates that TransMilenio has earned his public firm about $2.63 million selling CERs, all on a contract with the government of the Netherlands. The money is but a small fraction of the cost of operations, but TransMilenio officials insist that it is money badly needed to finance sustainability efforts and environmental monitoring of their system.
Andres Jara, who runs the Bogota office of the Institute for Transportation and Development Policy (ITDP), said the system has completely transformed his hometown. TransMilenio is now undertaking phase three of its 30-year expansion plan, which the city hopes will eventually include more than 200 miles of designated bus lanes and will incorporate all of the dozens of remaining independent bus operators into one centralized system.
Copycats look for CDM money
«The situation right now in developing countries and developing cities is that we have a lack of resources,» Jara said. «So what we showed with TransMilenio and BRT systems is that you can develop a strong transportation system with high quality, high efficiency, at a fraction of the cost.»
That lesson hasn’t gone unnoticed. Jara estimates that he has traveled to more than 100 countries in the past four years educating city planners on the BRT model, including China, where he aided Guangzhou’s efforts. The idea has since spread to South Africa, India and Indonesia, and new growth is expected in Mexico, Brazil, Argentina and possibly Tanzania.
Like Rojas at TransMilenio, Jara says that all transit planners he has met with expressed interest in tapping the CDM. He says it’s a wise move and he can see transportation CDM projects booming in popularity in the years to come.
«It’s not a lot, but it’s an additional income that is always helpful, useful, if you want to make more research on how you can improve the operation,» Jara said.
The CDM offices in Bonn, Germany, usually require project developers to show that their efforts couldn’t happen without the benefit of the carbon offset credit sales. But that hard requirement, termed «additionality,» has been watered down over the years as developers complain it is too rigid and has stymied the spread of CDM projects to smaller developing nations.
TransMilenio SA officials admit that they don’t need the CER cash to survive. But experts point out that public transportation projects are rarely profitable and almost always rely on significant outside financing for support, a strong argument in favor of CDM support. And much of the cash goes back into the emissions monitoring regime demanded by Bonn regulators.
«There are difficult aspects that we have to bear in mind, and the money helps us to be more sustainable,» Rojas said. «We can in fact work without this extra income. However, this income is very important for us.»
The other potential benefits for cities looking to follow Bogota’s example are numerous.
Cuts in traffic, pollution and crime
By taking cars and dirtier buses off the road, the city estimates, TransMilenio has prevented more than 2 million tons of CO2-equivalent greenhouse gases from entering the atmosphere. The city smog has been reduced, and health officials expect there will be fewer asthma-linked deaths. Residents even report that safety and security have greatly improved — robberies in traffic jams or on the city’s minibuses were common occurrences, so the city combats this with cameras in buses and stations and police patrols.
If future growth plans are rolled out as scheduled, Bogota officials expect further reductions in traffic, air pollution and crime, even as the city’s population expands and cars get cheaper. By 2030, TransMilenio officials say, 100 percent of Bogota’s public transit network will be theirs, cutting the number of total buses from 16,000 on the streets today to just 12,000.
And though he enjoys the CDM income today, Rojas admits that he’s worried about what may happen should nations fail to reach agreement on a new international climate change treaty and extend the life of the carbon offsetting system. The credits should continue to come in for another 10 years, as the European Union will still trade in CERs up to 2020, but beyond that, Rojas said, he will either have to seek out deals in the voluntary carbon market or come up with an alternative solution.
With the December 2012 Kyoto Protocol deadline looming, carbon offsetters will face pressure to get CDM projects registered as soon as possible. But Grütter says the cost and hassle involved in getting all the paperwork sorted out ahead of time will keep developing world public transportation projects from ever becoming as big a part of the CDM as he and others would like.
«If transport is to really play a larger role, you have to simplify the whole procedure quite a lot,» he said. «Very large cities with very large projects, they might go for it. But when you have a huge amount of intermediate cities, between half a million to 1 million, in developing countries, the project itself currently will be too small to warrant all these transaction costs.»
¿Comments? ¿Opinions? ¿Similar News? Send them to us!
Tweet
Opinion Pieces: Plans, plans and action! Or is it a promise?
Opinion Pieces: since 2007, Prof. David Hensher has written an opinion column in the Australasian Bus and Coach magazine, where he monthly discusses a lot of different transport-related hot topics. In this section we are revisiting these columns.
February 2010
February 2010 has been a month of new plans to ‘sort out’ Sydney’s ailing transport system. First we had the Sydney Morning Herald (SMH) Transport Blueprint with an almost total emphasis on public transport (some have said it should have been a transport and land use plan and not a public transport plan!). Then we had the NSW Government’s Metropolitan Transport Plan (previously announced as a Blueprint but downscaled). In many ways the SMH blueprint has outshone the government’s plan (the latter printing 50 shiny copies which is also available online here).
Now that the dust has settled, what might we observe about the two plans? First we have to recognize that much of what is offered will not even be started until well after the government’s current term in office. However this is not unusual since major infrastructure takes time to put in place. However, given that what we now have is at least the 5th plan with little action (in line with the plan) over the last 10 years, and that many of the proposed projects have been lightly appraised in respect of impact on key objectives, such as reducing congestion, improving accessibility and delivering value for money, it is not unreasonable to ask about the chances of specific projects ever happening?
The most dramatic feature of the government’s plan is the scrapping of the Metro and the almost total focus on central business district (CBD) centric transport investment. This may prove to be a mistake given that it was meant to go out West to Westmead and was more than a CBD metro, and most importantly was designed to create competition and to break the stranglehold on Cityrail and union power in the delivery of rail services which have been anything but efficient and effective. So this is a win for Cityrail, the union and wasteful spending. What we now have is a promise for line duplication to the west and the north.
The $50.2bn metropolitan transport plan pledges $6.7bn for a new train service to outer northwest Sydney (the Hills district), with work to commence in 2017. But while the blueprint promises «quadruplication» of the rail line between Chatswood and St Leonards on Sydney’s north shore, it makes no commitment to extra capacity on the harbour crossing. Two new rail tunnels will be needed under the harbour, at an estimated cost of $3-4bn. I commented in the Australian recently that «If a quadrupling of the line is needed because there’s evidence to suggest demand will require it and it will remove a bottleneck, there’s going to have to be recognition of getting across the Harbour Bridge.» and “likely public opposition to any proposal to add an extra deck to the bridge would leave the government with no option apart from tunnelling.” «What we’ve got here is very high-level commitments to projects that were once on the books and were taken off, but are now back on for political reasons.» A weakness of the transport blueprint was its assumption future rail users would want to take trips in and out of the city rather than making «circumferential» journeys. «Why are we quadrupling the line there in the first place?» A spokesman for NSW Transport Minister David Campbell said that an additional harbour crossing would be considered in the future.
When and if the north-west rail link is recommenced as a project, it would be appropriate to revisit the options that were considered almost eight years ago. These include bus rapid transit in tunnels along the lines of the Brisbane system (and yes it can deliver the same capacity as a tunnelled railway for considerably lower cost, making it look like, smell like and act line a rail system).
Most importantly however, the continued failure to look at more efficient and fairer charging schemes for car usage (apart from a flat $30 registration increase for most car classes), denies the system of an opportunity to raise sizeable sums of money to put back into the overall transport system so car users and public transport users (and the freight sector) can all benefit. It remains a puzzle as to what certain politicians believe that ‘roads should be free’. Clearly this is sending a message that people put little value on saving travel time!
Food for thought
¿Comments? ¿Opinions? ¿Similar News? Send them to us!
Tweet
Raising revenues through bus advertisements
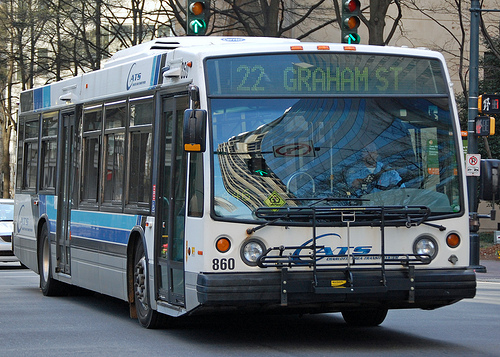
Source: The City Fix by Itir Sonuparlak.
Photo by Willamor Media
The Charlotte-Area Transit System (CATS) signed a five-year, $2.6 million contract with Titan, a transit advertising company, to allow advertisements on its fleet of buses and light rail. The agreement gives Titan the exclusive right to sell and manage advertising on the city’s public transit vehicles. The contract will allow exterior and interior advertising for buses and exterior advertising on the CATS light rail system. In return for the exclusive right to prime transit real estate, Titan guaranteed a $5 million profit to CATS in a span of five years.
CATS removed advertisements from its public transit vehicles in 2000 because the project was not cost-effective. CATS Marketing and Communication Manager Olaf Kinard believes the project will be more successful this time around because of the growth in Charlotte’s transit system. According to WSOC-TV, an ABC-affiliated television station in Charlotte, CATS’s fleet of buses grew from 120 to 330 since 2000. The LYNX Blue Line, the region’s first light rail service, is also a fairly new addition to the region’s public transit system, having started service in 2007. Overall, CATS provides transport to 25 million people annually with 70 bus and light rail routes.
This is an especially lucrative time for companies to advertise in Charlotte since the 2012 Democratic National Convention is scheduled to be held in the city’s Time Warner Cable Arena on September 3, 2012.
Charlotte is not alone in offering transit real estate for advertisements. New York City makes subway cars, buses, stations, panels on entryways to stations, and even the backs of metro cards available for advertisements, exposing these messages to millions of people who ride public transit every day.
But what do these advertisements mean to commuters? Kinard explains that the profits from this service can help cover costs, which could avoid an increase in fares. “It helps us manage our costs, especially with rising fuel prices,” he said in the interview with WSOC-TV.
¿Comments? ¿Opinions? ¿Similar News? Send them to us!
Tweet
EMBARQ India conducts training workshop on bus operations
Putting learning into practice to improve mass transit.
Source: EMBARQ
EMBARQ India, in association with the Institute of Urban Transport (IUT), conducted a three-day training workshop on bus operations for 27 officials from transport organizations and municipal corporations in 23 cities across India.
The workshop was based on materials contained in Bus Karo, a guidebook on bus planning and operations developed by EMBARQ India. The workshop covered topics including the role of buses in sustainable urban transport systems, planning for bus operations, including demand estimation and routing, methods of bus priority, technology and vehicles for bus operations, and financial analysis. The attendees also participated in field exercises in the city of Panjim, Goa.
In addition to three EMBARQ India staff – Madhav Pai, Amit Bhatt and Ashwin Prabhu – the workshop also saw presentations by Kishore Nathani from the Urban Mass Transit Company and Manjiri Akalkotkar of the Center for Environmental Planning and Technology University (CEPT).
As part of the Jawarharlal Nehru National Urban Renewal Mission (JnNURM), the Government of India provided 61 Indian cities with funding to procure more than 15,000 new buses. As a consequence of this program, city and state road transport projects have been undergoing a process of fleet expansion and renewal. Many cities without urban bus systems are planning to launch services with these new buses. Given the general lack of technical capacity in transport planning at the city and municipal government level, training in bus operations for transport officials is essential for developing high quality bus-based public transport systems.
The Ministry of Urban Development (MoUD) recently launched a large national capacity-building initiative in the field of urban transport. The Institute of Urban Transport (IUT), an undertaking of MoUD, is the nodal agency for implementing this initiative. This workshop was the first in a series planned by IUT in the coming year. EMBARQ India was invited to serve as the faculty for this workshop.
Funding for the workshop was provided by the Sustainable Urban Transport Project (SUTP), in partnership with Global Environment Facility (GEF) of the United Nations Development Programme (UNDP).
¿Comments? ¿Opinions? ¿Similar News? Send them to us!
Tweet
Assignment of work shifts to public transit drivers based on stated preferences
Transit agencies periodically assign each of their drivers with a shift describing when and for how long they will work each day in the following months. Since drivers are not indifferent to which shift they receive, transit agencies define different assignment methods often based on driver seniority. This article studies and compares different shift assignment policies assuming that the agency has some information regarding the approximate utility that each shift represents to each driver. Additionally, based on a study that analyzes driver utilities for flexible shifts (i.e. in which the weekly number of hours is not distributed uniformly along weekly working days), it shows that implementing flexible shifts offer a win-win opportunity for the agency and the drivers. On one hand drivers improve their productivity (i.e. fraction of the time in which drivers are actively working); on the other they increment their satisfaction with their job. This is particularly relevant since transit operational costs are strongly dependent on their labor force. Some of the benefits obtained by the firm should finally be captured by the users of the system.
Opinion Pieces: Going Dutch – listen to the future
Opinion Pieces: since 2007, Prof. David Hensher has written an opinion column in the Australasian Bus and Coach magazine, where he monthly discusses a lot of different transport-related hot topics. In this section we are revisiting these columns.
January 2010
There is a slow but growing realization that the future of public transport depends on the future of road pricing related to vehicle use, with a portion of revenue raised to be earmarked to public transport as a way of obtaining stakeholder buy in. The Dutch government is leading the way – it plans to scrap the road tax as well as the purchase tax on all new cars when the system is introduced in 2011. The Minister of Transport says this will provide a fairer system which taxes vehicle use, rather than ownership. Indeed, the minister says that more than half of Dutch road users will actually pay less under the road user charging scheme. According to calculations by motoring organizations, only motorists who drive more than 18,000kms a year are likely to be worse off under the new scheme. Currently in Sydney Private cars average 12,500km per annum, Household business cars average15,000kms per annum, and company cars average 22,000kms per annum.
A first implementation takes place in The Netherlands by 2011 for truck traffic and as of 2012 to 2016 for passenger cars. The motor vehicle tax (MRB) and the purchase tax (BPM) will be replaced by a system whereby the motorist pays depending on location, time and environmental aspects. The Automotive Telematics On-board unit Platform ATOP from NXP makes it possible to introduce pay-as-you-drive. It is safe, simple and very cost effective: it really is possible!
The Dutch government has determined that the costs of operating the national road user charge will not exceed five per cent of the proceeds. On November 16 last year the Dutch Cabinet agreed to the km charge for cars: 3 euro cents/km in 2012 increasing to 7 euro cents in 2017, equivalent of A$0.05/km in 2012 (or 50c/litre) or A$750 per annum (15,000km), compared to current registration fees (typically in Aust. around $300-$400). The 3 Euro Cents per km will increase to 6.75 Euro cents per km in 2018. The 3 euro cents is an average but varies by class of vehicle based on energy efficiency (A,B, C…). Hybrid vehicles will pay approximately 0.5-1 Euro cents per km. In 2012, however as part of a phase in program, the new charging regime will apply to only 20% of cars (selected via a lottery), with 100% covered by 2018. The charge will be a flat rate per km per class up to 2018; however from 2018 a peak rate will start, but only in Amsterdam, with a lower base (non-peak) rate when the peak rate is introduced. The entire scheme is designated as revenue neutral. It is claimed that 58% of people in entire country will be better off with significant reductions in congestion.
We look with great interest to the Netherlands. Will Australia like what it sees? It will certainly be much fairer than the very unfair (inequitable) system we have in place.
Food for thought
¿Comments? ¿Opinions? ¿Similar News? Send them to us!
Tweet
Thinking on public accountability: How to address quality of policy design and decision-making
T-MAPPER website launched
 Online database tracks actions to mitigate transport emissions.
Source: EMBARQ
EMBARQ and its partners are pleased to announce the launch of a new report and website, Transport Measures And Policies to Promote Emission Reductions (T-MAPPER), that provides information and data on national policies that help mitigate greenhouse gas emissions from the transport sector.
The transport sector currently accounts for a fifth of global carbon dioxide (CO2) emissions, and transport energy-related CO2 emissions are predicted to increase by 1.7 percent per year from 2004 to 2030. A large proportion of these emissions take place outside of Europe, and the largest growth is anticipated in developing countries.
The European Commission (EC) commissioned the T-MAPPER study to better understand and support the actions being taken outside of the European Economic Area (EEA) to mitigate transport emissions.
The project team was led by the Transport Research Laboratory (TRL), with support from the Istituto di Studi per l’Integrazione dei Sistemi (ISIS), the Energy Research Centre of the Netherlands (ECN), the Clean Air Initiative for Asian Cities (CAI-Asia), the German Technical Cooperation (GIZ) and EMBARQ.
According to the website, the project aims to:
- Provide a comprehensive understanding of policies being enacted outside the EEA to reduce the climate impact of the transport sector, some of which could be transferred to EEA countries, and;
- Provide information on possible mechanisms to support the reduction, or avoidance, of increases in Greenhouse Gas (GHG) emissions from transport (in other areas of the world).
To learn more, download the full report, two-page summaries for each of the 20 countries currently included in the database, or the data spreadsheets. EMBARQ contributed information about transport emissions reduction policies in the United States, Canada, Colombia, Mexico and Brazil.
Transport and climate experts are encouraged to submit information about policies that help cut transport-related greenhouse gas emissions by filling out this simple online form.
¿Comments? ¿Opinions? ¿Similar News? Send them to us!
Tweet