Information based on the research that is being conducted by Felipe Delgado, Juan Carlos Muñoz and Ricardo Giesen.
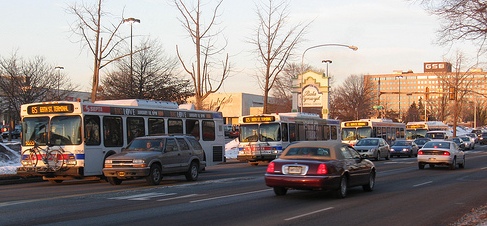 Bus transit services operated without a control system tend to result in vehicle bunching, which leads to an increase in bus headway variance and a consequent worsening of both the magnitude and variability of average waiting times. This phenomenon is produced, among other factors, by the variations in passenger demand. The above suggest than in order to maintain headway regularity and reduce passenger waiting times, control actions needs to be taken.
The simulation presented in the video shows a high frequency and high demand transit service (design headway of 2 minutes) where buses reach capacity at certain stops. The corridor has 10 km of length, with 30 bus stops evenly spaced. Bus capacity for all buses is 100 pax.
Each square represents a bus stop while each circle is a bus. The color of buses change during the simulation representing different load levels:
- Green : Bus loads between 0 and 1/4 of bus capacity
- Yellow: Bus loads between 1/4 and 1/2 of bus capacity
- Orange: Bus loads between 1/2 and 3/4 of bus capacity
- Red: Bus loads between 3/4 and capacity
Two different strategies under the same conditions are compared:
No Control: that is the spontaneous evolution of the system, where buses are dispatched from the terminal at a designed headway, without taking any control action along the route.
HBLRT: two simultaneous decisions are considered every time a bus reach a stop: (i) should the vehicle be held and for how long, and (ii) should the number of passengers allowed to board it be limited and by how many. While the former is a useful control mechanism in order to delay buses, the later is potentially attractive to speed-up the service.
A warm-up period of 15 minutes is considered before any of the two strategies is applied.
Note than under the No Control strategy buses tend to bunch even if they are dispatched at regular headways from the terminal. It can also be noted that loads between buses at a given stop present a great variability, with an important number of red buses in the center of the corridor followed by yellow or blue buses.
When the HBLRT strategy is applied, three important results can be observed: (i) the control method quickly restores and maintains even bus spacings, (ii) the buses run faster than under no control strategy reducing the length of the cycle, and (iii) the bus loads among buses present better regularity than under no control strategy.
The reductions in cycle length suggest that the HBLRT strategy is beneficial from the operator point of view, since the low variability allows a more robust operation and planning at the terminals. Furthermore, the reduction in cycle time also decreases the number of buses needed to provide a given frequency.
The better regularity in bus loads is very relevant for users, since discomfort only happens at high load factors. So, a more balanced load factor across buses yields a more comfortable experience to users. Please note that a very uncomfortable bus is suffered by much more users than a quite comfortable one.
These findings therefore suggest that the HBLRT strategy improves comfort compared to the other strategies, allowing buses to travel less crowded and providing a more reliable experience.
References:
Delgado, F., Muñoz, J.C., Giesen, R. and Cipriano, A. (2009) Real-Time Control of Buses in a Transit Corridor Based on Vehicle Holding and Boarding Limits. Transportation Research Record 2090, 59-67.
Delgado, F., Muñoz, J.C., Giesen, R . (2011) Analysis Of Bus Boading Limits Real-Time Control Strategy: When and How Much Limiting Bus Boarding Improve Performance? Working paper.
¿Comments? ¿Opinions? ¿Similar News? Send them to us!

